Bitcoin price started a downside correction below $28,000. BTC is now testing the $27,200 support and might start a fresh increase in the near term.
Bitcoin is moving lower below the $28,000 and $27,800 support levels.
The price is trading below $27,500 and the 100 hourly Simple moving average.
There is a short-term bearish trend line forming with resistance near $27,500 on the hourly chart of the BTC/USD pair (data feed from Kraken).
The pair could start another increase unless there is a move below the $26,650 support.
Bitcoin price failed to continue higher above the $28,500 resistance. BTC formed a short-term top and recently started a downside correction below the $28,000 level.
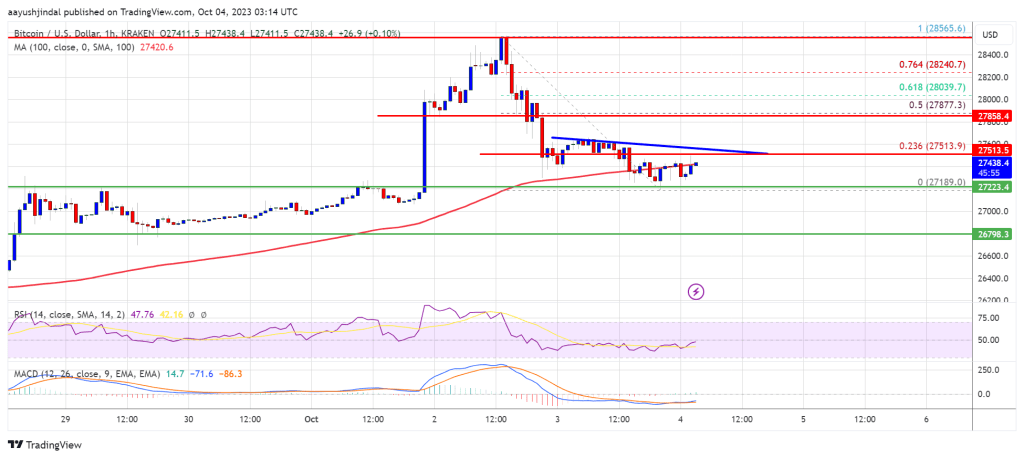
There was a move below the $27,500 level and the 100 hourly Simple moving average. The price is now testing the $27,200 support zone. A low is formed near $27,189 and the price is now consolidating losses, with very few signs of more losses.
Bitcoin is now trading below $27,500 and the 100 hourly Simple moving average. Immediate resistance on the upside is near the $27,500 level. There is also a short-term bearish trend line forming with resistance near $27,500 on the hourly chart of the BTC/USD pair. It is close to the 23.6% Fib retracement level of the recent decline from the $28,565 swing high to the $27,189 low.
Source: BTCUSD on TradingView.com
The next key resistance could be near the $27,880 level or the 50% Fib retracement level of the recent decline from the $28,565 swing high to the $27,189 low. A close above the $27,880 resistance could start another increase. In the stated case, the price could climb toward the $28,500 resistance. Any more gains might call for a move toward the $29,200 level.
If Bitcoin fails to continue higher above the $27,500 resistance, there could be more downsides. Immediate support on the downside is near the $27,200 level.
The next major support is near the $27,000 level. The main support is now near $26,800. A downside break and close below the $26,800 level might send the price toward $26,200. The next support sits at $26,000.
Technical indicators:
Hourly MACD – The MACD is now losing pace in the bullish zone.
Hourly RSI (Relative Strength Index) – The RSI for BTC/USD is now below the 50 level.
Major Support Levels – $27,200, followed by $26,800.
Major Resistance Levels – $27,500, $27,880, and $28,500.
[#item_full_content]NewsBTCRead MoreCrypto analyst Ardi has pointed to a bear market divergence to explain what has been…
Bitcoin is hovering near the $71,000 mark, consolidating after recent swings as the market digests…
First-quarter purchases have reached 89,618 BTC so far, the most since fourth-quarter 2024, and the…
Bitcoin (BTC) is showing early signs of a prolonged decline after peaking in October 2025.…
According to a recent on-chain data evaluation, the Bitcoin price might not be seeing a…
The Bitcoin market remains subject to high uncertainty, with bearish sentiments at heightened levels. In…