Bitcoin price started a strong increase and traded above the $75,500 zone. BTC is now consolidating and might aim for more gains if it clears $76,000.
Bitcoin started a decent upward move above the $75,000 zone.
The price is trading above $73,500 and the 100 hourly simple moving average.
There is a bullish trend line forming with support at $72,000 on the hourly chart of the BTC/USD pair (data feed from Kraken).
The pair might continue to rise if it clears the $75,000 and $76,000 levels.
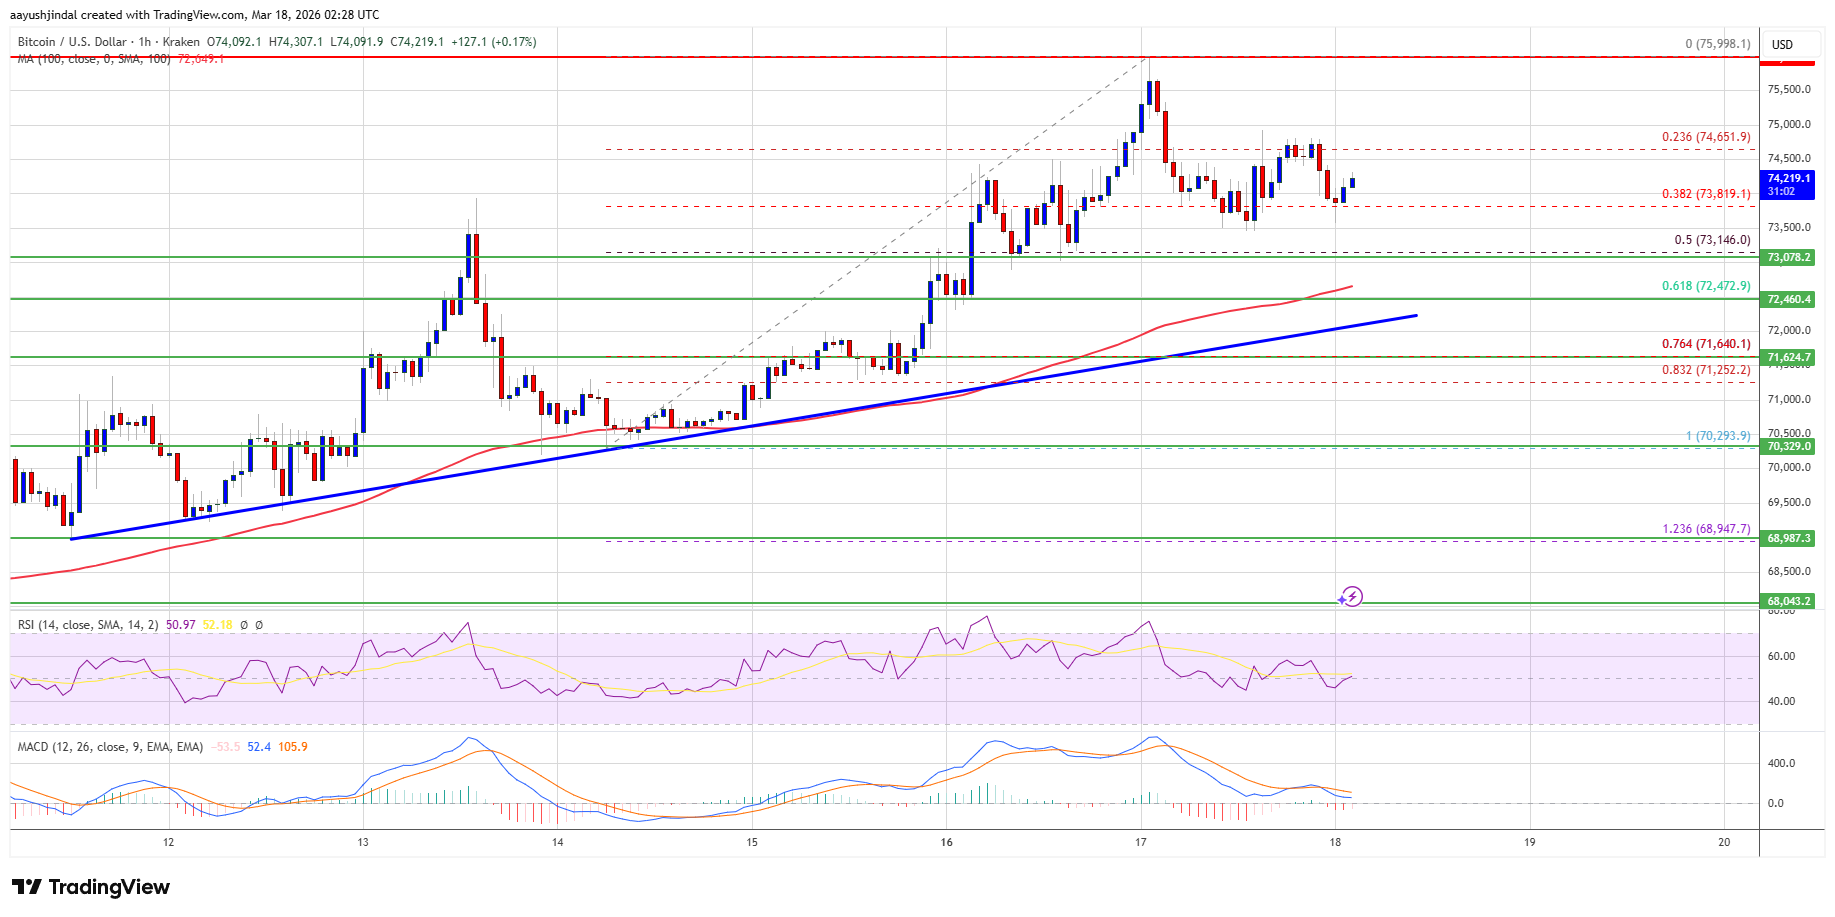
Bitcoin price remained supported and extended its increase above the $73,500 level. BTC climbed above the $74,200 and $74,500 resistance levels.
The bulls were able to pump the price above $75,000. A high was formed at $75,998, and the price recently corrected some gains. There was a move below the 23.6% Fib retracement level of the recent upward move from the $70,292 swing low to the $75,998 high.
Bitcoin is now trading above $73,500 and the 100 hourly simple moving average. Besides, there is a bullish trend line forming with support at $72,000 on the hourly chart of the BTC/USD pair.
If the price remains stable above $72,000, it could attempt a fresh increase. Immediate resistance is near the $75,000 level. The first key resistance is near the $75,500 level. A close above the $75,500 resistance might send the price further higher. In the stated case, the price could rise and test the $76,200 resistance. Any more gains might send the price toward the $77,500 level. The next barrier for the bulls could be $78,000.
If Bitcoin fails to rise above the $75,000 resistance zone, it could start another decline. Immediate support is near the $73,800 level. The first major support is near the $73,150 level or the 50% Fib retracement level of the recent upward move from the $70,292 swing low to the $75,998 high.
The next support is now near the $72,000 zone and the trend line. Any more losses might send the price toward the $71,650 support in the near term. The main support now sits at $71,200, below which BTC might struggle to recover in the near term.
Technical indicators:
Hourly MACD – The MACD is now losing pace in the bullish zone.
Hourly RSI (Relative Strength Index) – The RSI for BTC/USD is now above the 50 level.
Major Support Levels – $73,800, followed by $73,150.
Major Resistance Levels – $75,000 and $76,200.
[#item_full_content]NewsBTCRead MoreA single on-chain indicator has quietly called every major Bitcoin cycle bottom for the past…
Strategy has once again strengthened its aggressive digital asset vault, adding another billion-dollar allocation of…
Bitcoin Magazine Jack Mallers Confirmed As A Bitcoin 2026 Speaker Jack Mallers has been officially…
Bitcoin Magazine From $5 to $75,000: Bitcoin’s Saint Patrick’s Day Prices Shows You the Wild…
Hot PPI inflation data in the morning and hawkish remarks by Powell in the afternoon…
Bitcoin Magazine Bitcoin Price Dances Near $75,000 as Market Questions ‘Decoupling’ Narrative Bitcoin price traded…