Bitcoin price jumped from the $40,500 support zone. BTC is up over 5% but the bears are still defending the $43,500 resistance zone.
Bitcoin started a strong increase from the $40,500 support zone.
The price is trading above $42,000 and the 100 hourly Simple moving average.
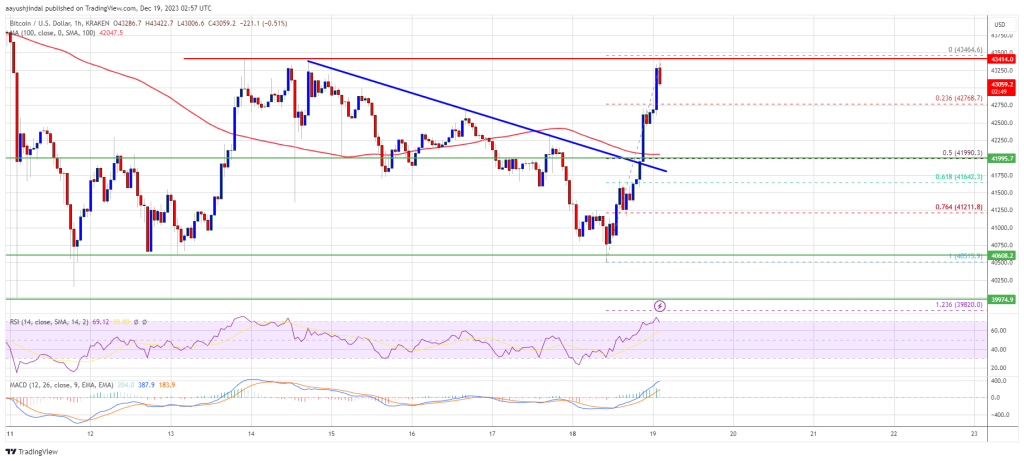
There was a break above a major bearish trend line with resistance near $41,850 on the hourly chart of the BTC/USD pair (data feed from Kraken).
The pair could decline again if it fails to clear the $43,500 resistance zone.
Bitcoin price extended its decline below the $41,200 support level. However, BTC remained well-bid above the $40,500 support zone. A low was formed near $40,515 and the price started a fresh increase.
There was a steady increase above the $41,200 and $42,000 levels. There was a break above a major bearish trend line with resistance near $41,850 on the hourly chart of the BTC/USD pair. The pair rallied above the $43,000 resistance zone.
Bitcoin is now struggling to clear the key $43,500 resistance zone. A high is formed near $43,464 and the price is now consolidating gains. It is above the 23.6% Fib retracement level of the upward move from the $40,515 swing low to the $43,464 high.
It is well above $42,000 and the 100 hourly Simple moving average. On the upside, immediate resistance is near the $43,250 level. The first major resistance is forming near $43,500. A close above the $43,500 resistance might start a steady increase.
Source: BTCUSD on TradingView.com
The next key resistance could be near $44,200, above which BTC could rise toward the $45,000 level. A clear move above the $45,000 level could set the pace for a test of $46,500.
If Bitcoin fails to rise above the $43,500 resistance zone, it could start a fresh decline. Immediate support on the downside is near the $42,750 level.
The next major support is near $42,000 or the 50% Fib retracement level of the upward move from the $40,515 swing low to the $43,464 high. If there is a move below $42,000, there is a risk of more losses. In the stated case, the price could drop toward the $40,500 support in the near term.
Technical indicators:
Hourly MACD – The MACD is now gaining pace in the bullish zone.
Hourly RSI (Relative Strength Index) – The RSI for BTC/USD is now above the 20 level.
Major Support Levels – $42,750, followed by $42,000.
Major Resistance Levels – $43,200, $43,500, and $45,000.
[#item_full_content]NewsBTCRead MoreBitcoin Magazine South African Eskom Considering Discount Power for Bitcoin Miners as Solar Creates Surplus…
Surging to a near one-month high of $74,000, bitcoin reversed back to just above $71,000…
The billionaire investor said stablecoins could become the whole payment system in 10-15 years, and…
Wall Street’s biggest gold fund saw something unusual recently — a single-day outflow of $3…
Falling oil prices are helping, but a bounce seemed in the cards after some of…
Bitcoin Magazine Bitcoin Price Reclaims $73,000 as War Shakes Markets, Outperforming Gold and Stocks The…