Bitcoin price started a downside correction from the $70,000 resistance. BTC is now correcting gains and might extend losses if it trades below $66,000.
Bitcoin struggled near $70,000 and started a downside correction.
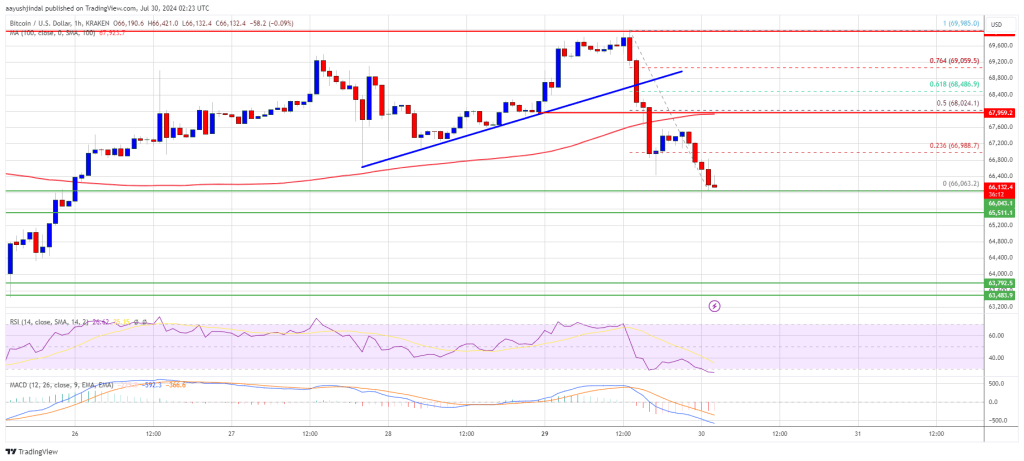
The price is trading below $68,500 and the 100 hourly Simple moving average.
There was a break below a key bullish trend line with support at $68,620 on the hourly chart of the BTC/USD pair (data feed from Kraken).
The pair might extend losses if it fails to stay above the $66,000 support zone.
Bitcoin price extended gains above the $68,500 resistance zone. BTC even spiked toward the $70,000 resistance zone. However, it failed to stay near $70,000 and started a downside correction.
There was a move below the $68,500 and $68,000 support levels. Besides, there was a break below a key bullish trend line with support at $68,620 on the hourly chart of the BTC/USD pair. The pair even declined below the $66,500 support zone.
It tested the $66,000 zone. A low is formed at $66,063 and the price is now consolidating losses. Bitcoin price is trading below $68,500 and the 100 hourly Simple moving average.
On the upside, the price could face resistance near the $67,000 level. The first key resistance is near the $67,200 level or the 23.6% Fib retracement level of the downward move from the $69,985 swing high to the $66,036 low. A clear move above the $67,200 resistance might send the price further higher in the coming sessions.
The next key resistance could be $68,000 or the 50% Fib retracement level of the downward move from the $69,985 swing high to the $66,036 low. The next major hurdle sits at $68,500. A close above the $68,500 resistance might spark bullish moves. In the stated case, the price could rise and test the $70,000 resistance.
If Bitcoin fails to recover above the $67,200 resistance zone, it could start another decline. Immediate support on the downside is near the $66,000 level.
The first major support is $65,500. The next support is now near $65,000. Any more losses might send the price toward the $63,500 support zone in the near term.
Technical indicators:
Hourly MACD – The MACD is now gaining pace in the bearish zone.
Hourly RSI (Relative Strength Index) – The RSI for BTC/USD is now below the 50 level.
Major Support Levels – $66,000, followed by $65,500.
Major Resistance Levels – $67,200, and $68,000.
[#item_full_content]NewsBTCRead MoreOver the last few days, the Bitcoin price has fluctuated, but the most prominent moves…
Standard Chartered has sharply reduced its famously bullish Bitcoin roadmap, cutting its 2026 price target…
Ark Invest’s CEO and CIO, Cathie Wood, joined Fox Business’s “Morning With Maria” to discuss…
Market depth in smaller tokens remained thin, echoing the uneven liquidity that has characterized December…
Bitcoin is holding above $90,000 as the market heads into a highly anticipated FOMC meeting,…
During what many anticipated would be the year of a major Bitcoin (BTC) bull run,…