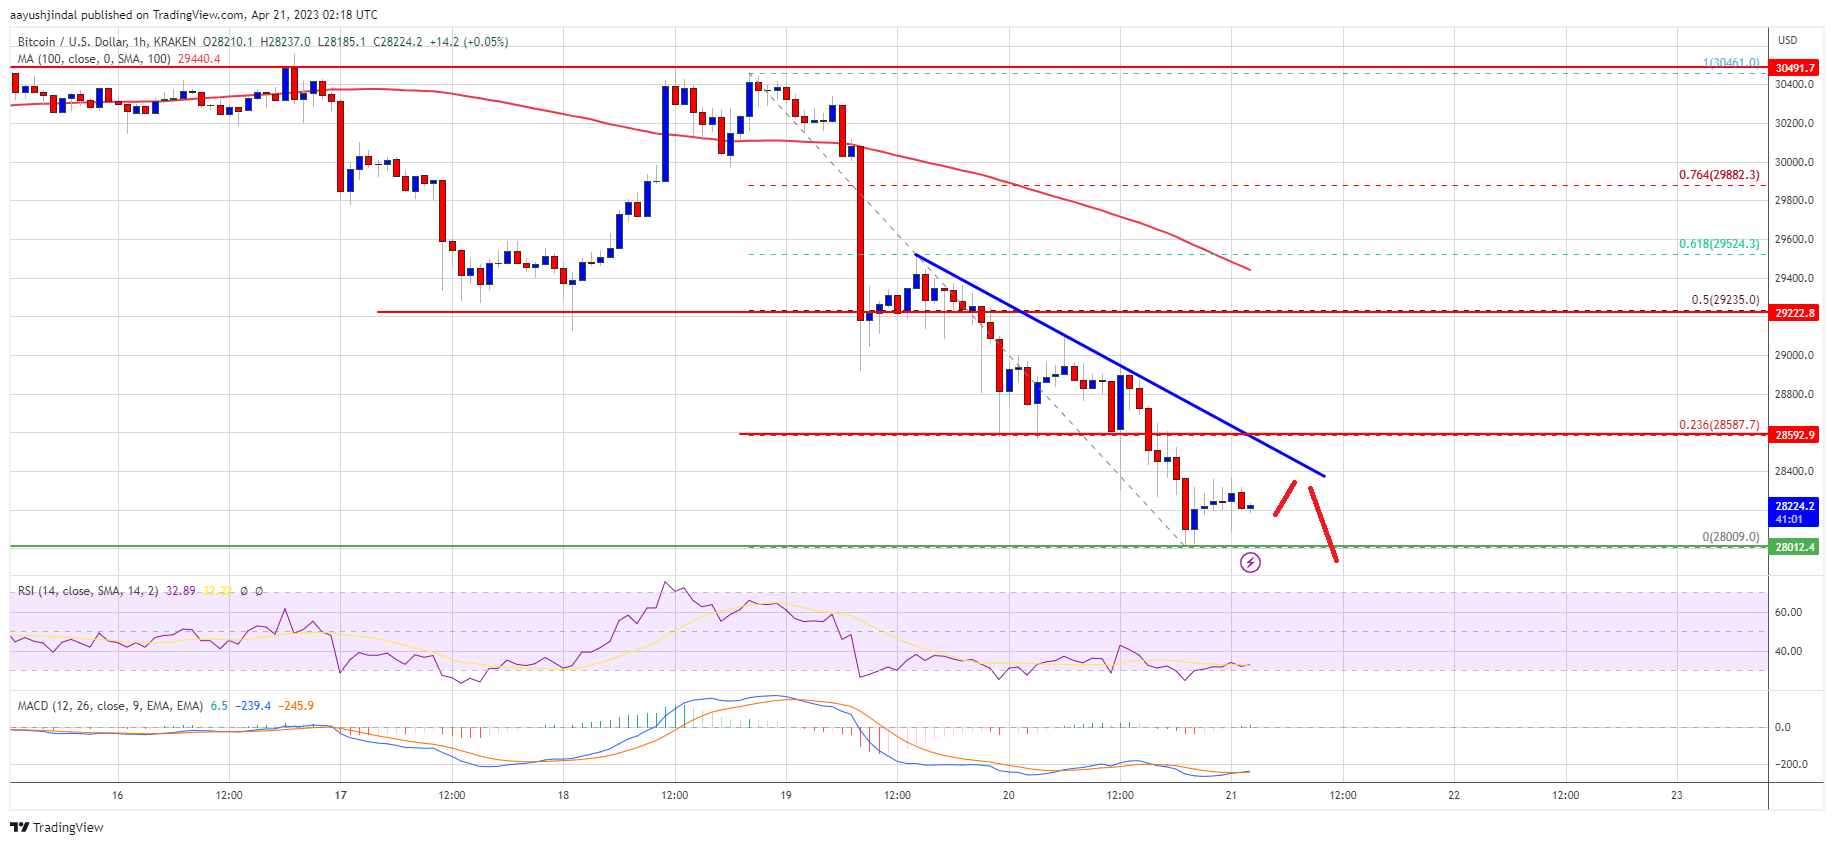
Bitcoin price is moving lower below $29,000. BTC could extend losses below $28,000 and revisit the $27,200 support zone in the near term.
Bitcoin remained in a bearish zone below the $29,500 support zone.
The price is trading below $29,000 and the 100 hourly Simple moving average.
There is a major bearish trend line forming with resistance near $28,500 on the hourly chart of the BTC/USD pair (data feed from Kraken).
The pair could continue to move down if it breaks the $28,000 support zone.
Bitcoin price started a fresh decline from the $30,500 resistance zone. BTC traded below the $30,000 and $29,500 levels to move into a short-term bearish zone.
The bears gained strength below the $29,000 level. They were able to push the price toward the $28,000 support zone. A low is formed near $28,009 and the price is now consolidating losses. Bitcoin price is now trading well below $29,000 and the 100 hourly Simple moving average.
Immediate resistance is near the $28,500 level. There is also a major bearish trend line forming with resistance near $28,500 on the hourly chart of the BTC/USD pair.
The 23.6% Fib retracement level of the downward move from the $30,461 high to the $28,009 low is also just above the trend line. The first major resistance is forming near the $28,800 level. The next major resistance is near the $29,250 zone.
Source: BTCUSD on TradingView.com
It is close to the 50% Fib retracement level of the downward move from the $30,461 high to the $28,009 low. A move above the $29,250 resistance might call for a decent increase. In the stated case, the price may perhaps revisit the $30,000 zone. Any more gains could open the doors for a test of $30,500.
If Bitcoin’s price fails to clear the $28,500 resistance, it could continue to move down. Immediate support on the downside is near the $28,100 level.
The next major support is near the $28,000 zone. A downside break and close below the $28,000 support might push the price toward the $27,400 support. Any more losses might push Bitcoin toward $27,200.
Technical indicators:
Hourly MACD – The MACD is now gaining pace in the bearish zone.
Hourly RSI (Relative Strength Index) – The RSI for BTC/USD is now below the 50 level.
Major Support Levels – $28,000, followed by $27,200.
Major Resistance Levels – $28,500, $28,800, and $29,250.
[#item_full_content]NewsBTCRead MoreBitcoin Magazine Bitcoin Price Jumps Above $64,000 as Cooler-Than-Expected Inflation Strengthens the Case for Rate…
BIP-110 sought to limit non-financial data on Bitcoin's blockchain but instead reignited debates over censorship…
Your day-ahead look for July 14, 2026Read MoreCoinDesk: Bitcoin, Ethereum, Crypto News and Price Data[#item_full_content]
Bitcoin consolidated after Monday's selloff as Donald Trump threatened more Iran strikes, gold extended its…
Long-term holders are quietly transferring supply to a new generation of buyers, but looming Federal…
Trump reinstated the Hormuz blockade, sending oil higher and rate-hike bets up, reversing the peace…