Bitcoin price is moving lower below $29,000. BTC could extend losses below $28,000 and revisit the $27,200 support zone in the near term.
Bitcoin remained in a bearish zone below the $29,500 support zone.
The price is trading below $29,000 and the 100 hourly Simple moving average.
There is a major bearish trend line forming with resistance near $28,500 on the hourly chart of the BTC/USD pair (data feed from Kraken).
The pair could continue to move down if it breaks the $28,000 support zone.
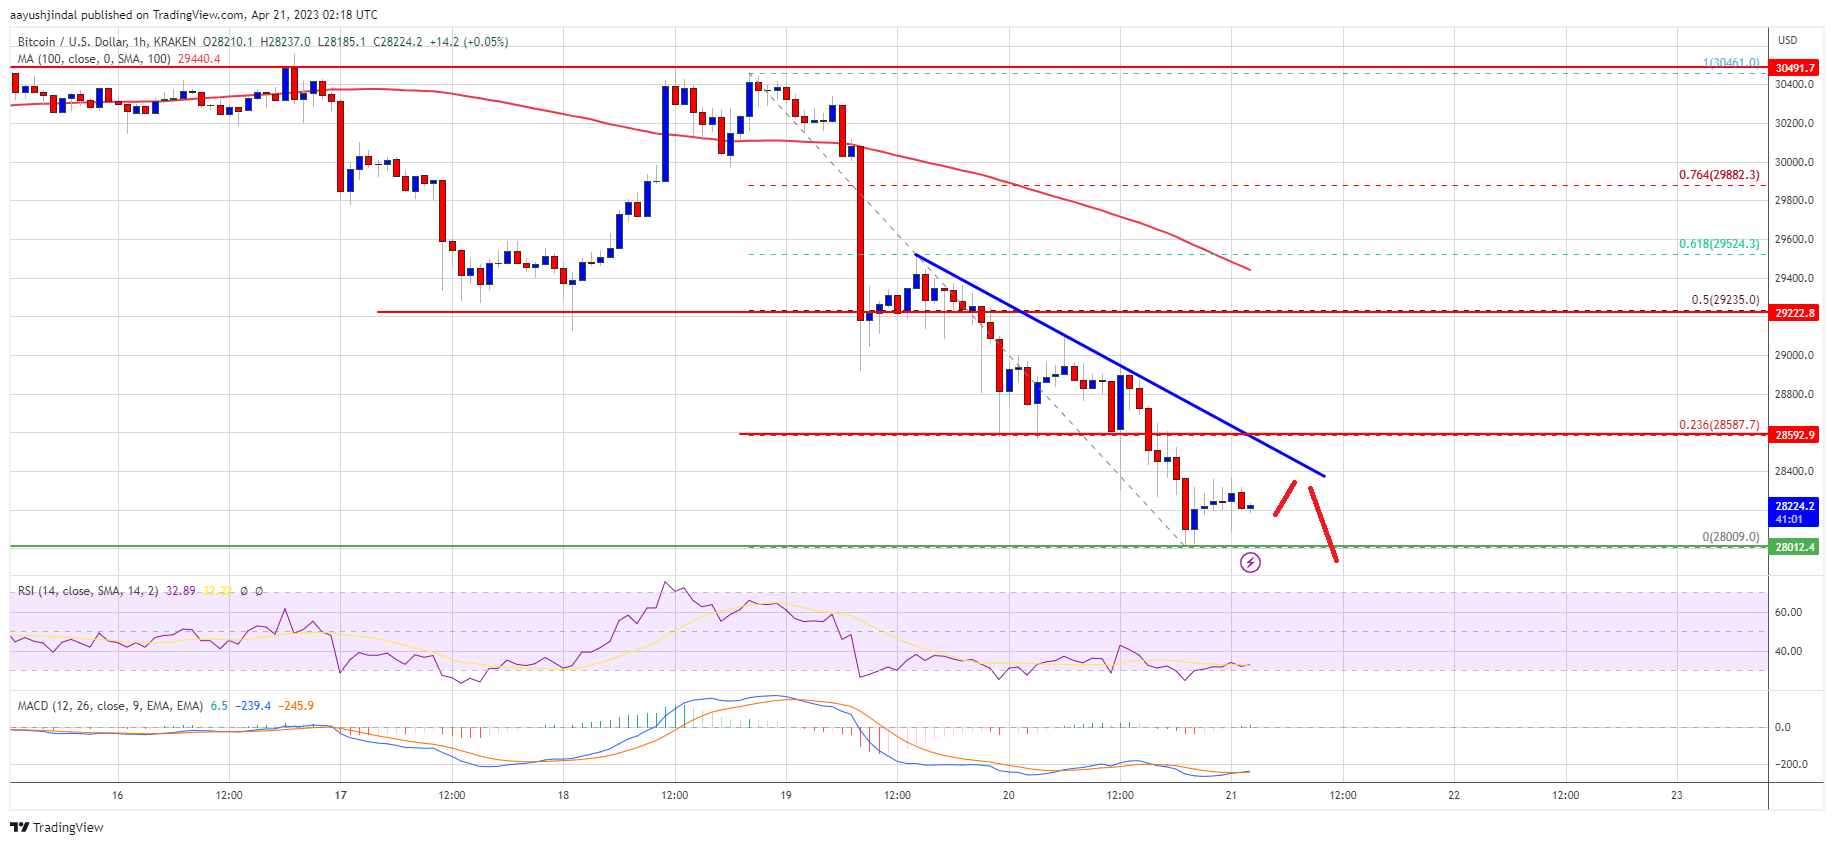
Bitcoin price started a fresh decline from the $30,500 resistance zone. BTC traded below the $30,000 and $29,500 levels to move into a short-term bearish zone.
The bears gained strength below the $29,000 level. They were able to push the price toward the $28,000 support zone. A low is formed near $28,009 and the price is now consolidating losses. Bitcoin price is now trading well below $29,000 and the 100 hourly Simple moving average.
Immediate resistance is near the $28,500 level. There is also a major bearish trend line forming with resistance near $28,500 on the hourly chart of the BTC/USD pair.
The 23.6% Fib retracement level of the downward move from the $30,461 high to the $28,009 low is also just above the trend line. The first major resistance is forming near the $28,800 level. The next major resistance is near the $29,250 zone.
Source: BTCUSD on TradingView.com
It is close to the 50% Fib retracement level of the downward move from the $30,461 high to the $28,009 low. A move above the $29,250 resistance might call for a decent increase. In the stated case, the price may perhaps revisit the $30,000 zone. Any more gains could open the doors for a test of $30,500.
If Bitcoin’s price fails to clear the $28,500 resistance, it could continue to move down. Immediate support on the downside is near the $28,100 level.
The next major support is near the $28,000 zone. A downside break and close below the $28,000 support might push the price toward the $27,400 support. Any more losses might push Bitcoin toward $27,200.
Technical indicators:
Hourly MACD – The MACD is now gaining pace in the bearish zone.
Hourly RSI (Relative Strength Index) – The RSI for BTC/USD is now below the 50 level.
Major Support Levels – $28,000, followed by $27,200.
Major Resistance Levels – $28,500, $28,800, and $29,250.
[#item_full_content]NewsBTCRead MoreBitcoin Magazine David Bailey Confirmed As A Bitcoin 2026 Speaker David Bailey has been officially…
Bitcoin Magazine Paraguay Adopts Stricter Crypto Oversight, Mandates Detailed Transaction on Bitcoin Reporting Paraguay’s National…
Bitcoin Magazine Policy Group Calls for Bitcoin Inclusion in Proposed Crypto Tax Exemption The Bitcoin…
Bitcoin Magazine Corporate Bitcoin Holdings Hit Record High as Institutions Accumulate 2.8x Mining Supply: Report…
Research shows that only 8% to 10% of global Bitcoin hashrate runs in oil-sensitive power…
Today’s quantum computers are far from breaking Bitcoin’s cryptography and any real threat would likely…