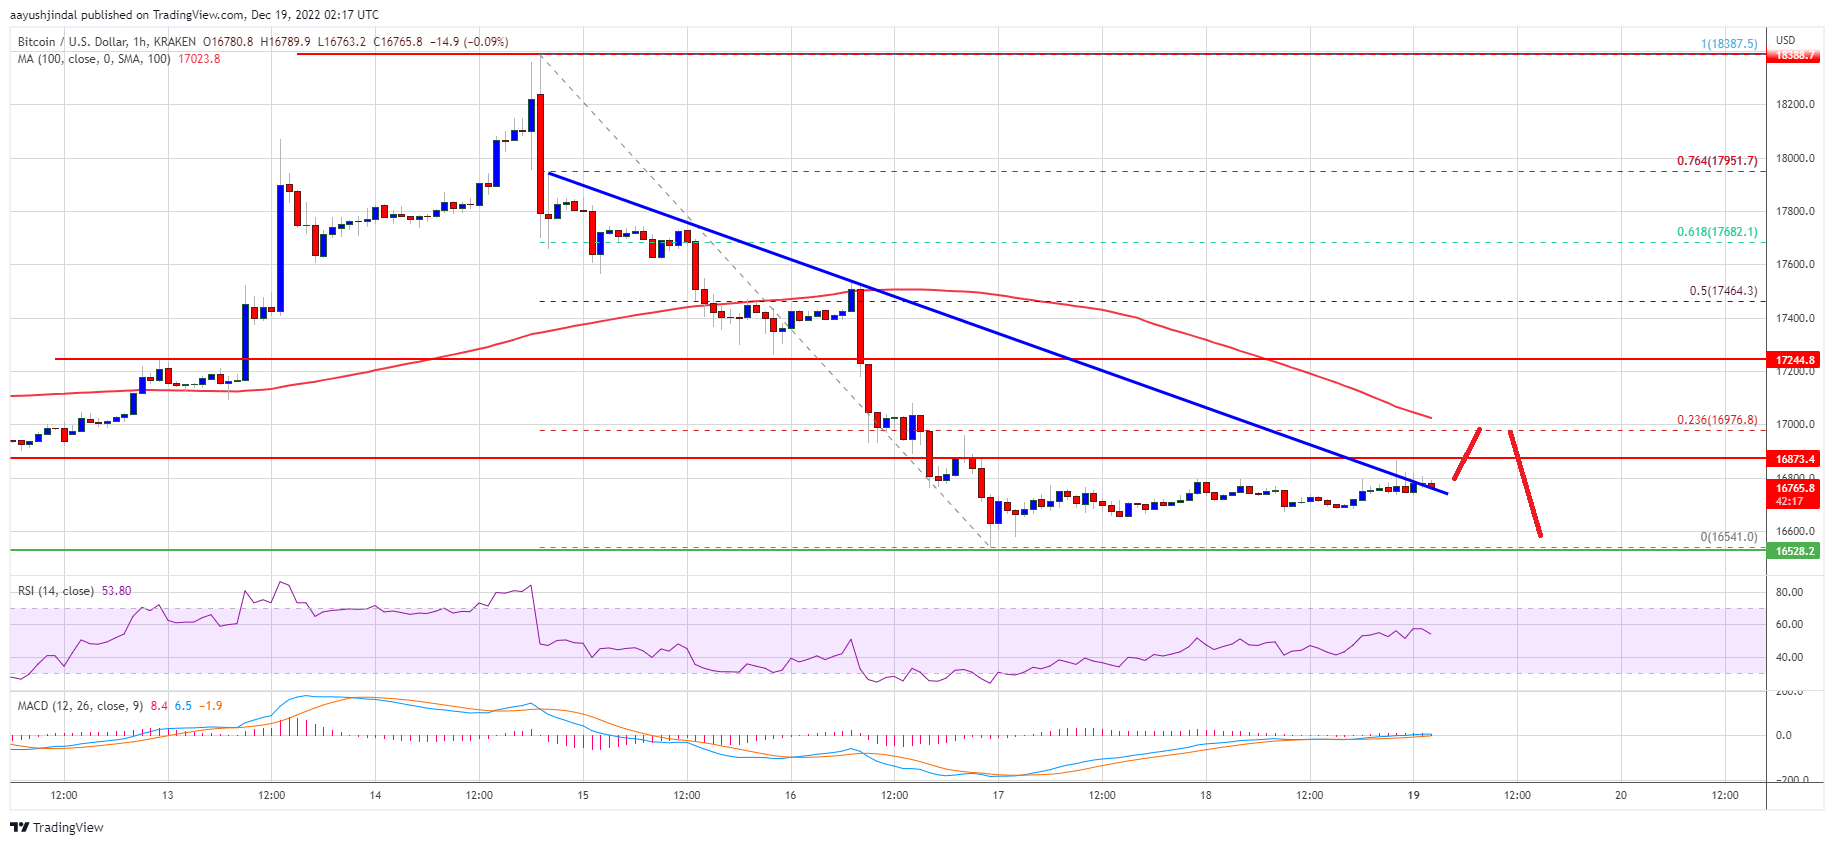
Bitcoin price declined heavily and traded below $17,000. BTC is consolidating losses and remains at a risk of more losses below the $16,500 support.
Bitcoin started a fresh decline below the $17,200 and $17,000 support levels.
The price is trading below $17,000 and the 100 hourly simple moving average.
There is a key bearish trend line forming with resistance near $16,800 on the hourly chart of the BTC/USD pair (data feed from Kraken).
The pair could continue to move lower unless it clears the 100 hourly SMA.
Bitcoin price restarted a fresh decline from the $18,400 zone resistance zone. BTC gained pace below the $17,500 and $17,200 support levels. The bears even pushed it below the $17,000 level and the 100 hourly simple moving average.
It tested the $16,500 support zone. A low is formed near $16,541 and the price is now consolidating losses. It climbed a few points higher and traded above the $16,700 level.
Bitcoin price is now trading below $17,000 and the 100 hourly simple moving average. On the upside, an immediate resistance is near the $16,800 zone. There is also a key bearish trend line forming with resistance near $16,800 on the hourly chart of the BTC/USD pair.
The first major resistance is near the $17,000 zone and the 100 hourly simple moving average. It is near the 23.6% Fib retracement level of the downward move from the $18,387 swing high to $16,541 swing low.
Source: BTCUSD on TradingView.com
A clear move above the $17,000 resistance might call for a move towards the $17,500 resistance. It is close to the 50% Fib retracement level of the downward move from the $18,387 swing high to $16,541 swing low. The next major resistance is near $17,800, above which the price might gain pace and rise towards the $18,000 level.
If bitcoin fails to clear the $17,000 resistance, there could be more downsides. An immediate support on the downside is near the $16,600 level.
The next major support is near the $16,500 zone. A downside break below the $16,500 support might call more losses. In the stated case, the price could decline towards the $16,000 support in the near term. Any more losses might send the price towards $15,500.
Technical indicators:
Hourly MACD – The MACD is now losing pace in the bearish zone.
Hourly RSI (Relative Strength Index) – The RSI for BTC/USD is now above the 50 level.
Major Support Levels – $16,600, followed by $16,500.
Major Resistance Levels – $16,800, $17,000 and $17,500.
Tags: bitcoinbitcoin pricebtcusdBTCUSDTxbtusd
NewsBTCRead More
Bitcoin's move, led by unwinding of shorts, has lifted the broader crypto market, with the…
A short message from Michael Saylor has once again stirred speculation that Strategy could be…
Bitcoin price started a strong increase above the $75,000 zone. BTC is now consolidating and…
A potential US military strike on Iran’s main oil export terminal helped push Bitcoin to…
Bitcoin Magazine Bitcoin Price Surges Above $75,000 as Bullish Momentum Builds The bitcoin price climbed…
The alleged theft of 2,323 bitcoin has triggered a High Court dispute testing how English…