Bitcoin price is again rising above the $70,000 resistance zone. BTC seems to be setting up for a steady increase above the $71,500 resistance zone.
Bitcoin price is climbing higher and above the $70,000 resistance zone.
The price is trading above $70,500 and the 100 hourly Simple moving average.
There is a crucial bullish trend line forming with support at $70,200 on the hourly chart of the BTC/USD pair (data feed from Kraken).
The pair could soon start a fresh rally if it clears the $71,500 resistance zone.
Bitcoin price remained well-supported above the $69,000 resistance zone. BTC climbed higher the $70,000 resistance zone to move again into a positive zone.
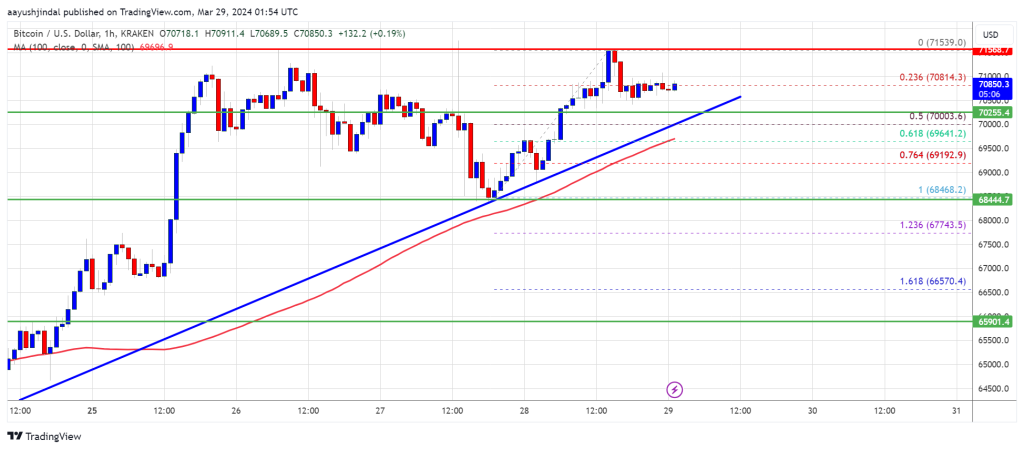
The price broke the $71,000 level and retested $71,500. A high was formed near $71,539 and there was a downside correction. There was a minor decline below the 23.6% Fib retracement level of the upward move from the $68,468 swing low to the $71,539 high.
Bitcoin is now trading above $70,000 and the 100 hourly Simple moving average. There is also a crucial bullish trend line forming with support at $70,200 on the hourly chart of the BTC/USD pair.
Source: BTCUSD on TradingView.com
Immediate resistance is near the $71,200 level. The first major resistance could be $71,500. If there is a clear move above the $71,500 resistance zone, the price could start a strong increase. In the stated case, the price could even clear the $72,500 resistance zone in the near term. The next major resistance is near the $73,500 zone.
If Bitcoin fails to rise above the $71,500 resistance zone, it could start another decline. Immediate support on the downside is near the $70,200 level and the trend line.
The first major support is $70,000 and the 50% Fib retracement level of the upward move from the $68,468 swing low to the $71,539 high. The next support sits at $69,200. If there is a close below $69,200, the price could start a drop toward the $68,000 level. Any more losses might send the price toward the $66,500 support zone in the near term.
Technical indicators:
Hourly MACD – The MACD is now gaining pace in the bullish zone.
Hourly RSI (Relative Strength Index) – The RSI for BTC/USD is now above the 50 level.
Major Support Levels – $70,200, followed by $69,200.
Major Resistance Levels – $71,200, $71,500, and $73,500.
[#item_full_content]NewsBTCRead MoreBitcoin is often celebrated as a decentralized network, with mining power distributed globally to ensure…
Bitcoin (BTC) faces a stark downside risk that could send prices below the previous bear…
Crypto analyst Jordan has predicted that the Bitcoin price could rally to $80,000 in the…
The financial services giant with almost $12 trillion in client assets is moving closer to…
Bitcoin Magazine Jack Dorsey Reveals Bitcoin Faucet Revival with “Bitcoin Day” Announcement Tech entrepreneur and…
Bitcoin Magazine Charles Schwab Teases Direct Bitcoin Trading With New ‘Schwab Crypto’ Account Financial services…