Bitcoin price failed to clear $18,000 and corrected lower. BTC is signaling bearish signs and might even start a fresh decline in the coming sessions.
Bitcoin started a downward move and traded below the $17,600 support.
The price is trading below $17,500 and the 100 hourly simple moving average.
There was a break below a major bullish trend line with support near $17,620 on the hourly chart of the BTC/USD pair (data feed from Kraken).
The pair could continue to move lower unless it reclaims the 100 hourly SMA.
Bitcoin price attempted an upside break above the $18,400 zone resistance zone. BTC failed to stay above the $18,000 pivot level and reacted the downside.
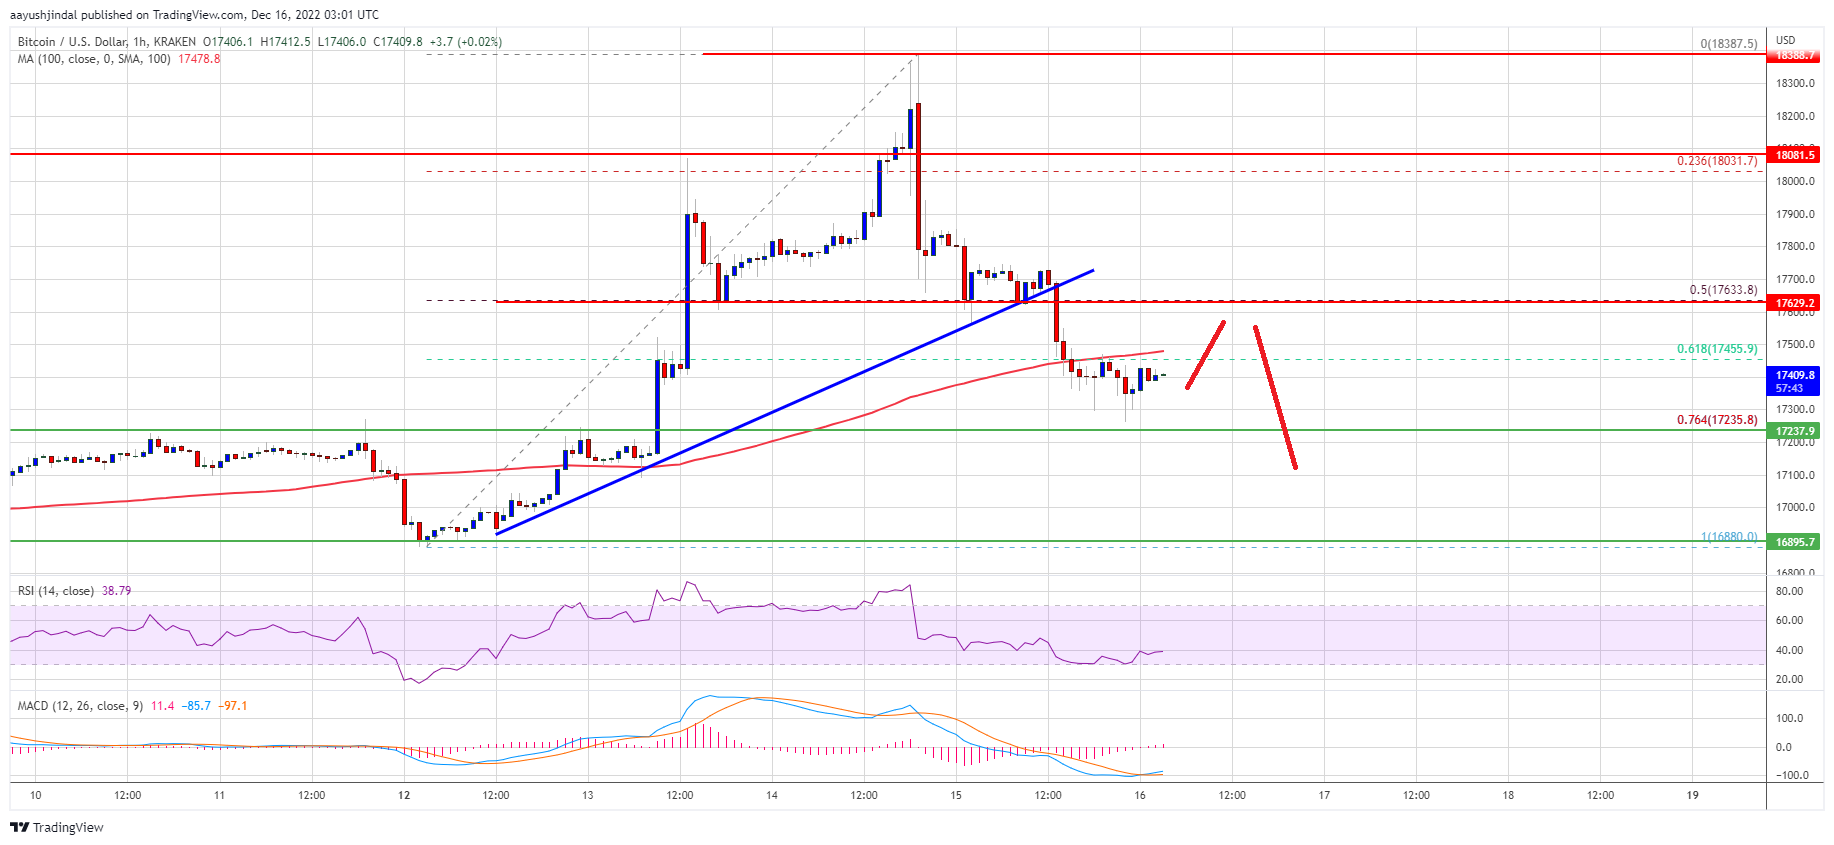
A high was formed near $18,387 before the price started a fresh decline. There was a clear move below the $18,200 and $18,000 levels. The price declined below the 50% Fib retracement level of the key wave from the $16,881 low to $18,387 high.
Besides, there was a break below a major bullish trend line with support near $17,620 on the hourly chart of the BTC/USD pair. Bitcoin price is now below $17,500 and the 100 hourly simple moving average.
Source: BTCUSD on TradingView.com
On the upside, an immediate resistance is near the $17,500 level and the 100 hourly simple moving average. The first major resistance is near the $17,650 zone, above which the price may perhaps revisit the $18,000 zone. The next major resistance is near $18,380, above which the price might gain pace and rise towards the $19,000 level.
If bitcoin fails to clear the $17,650 resistance, there could be more downsides. An immediate support on the downside is near the $17,240 level. It is near the 76.4% Fib retracement level of the key wave from the $16,881 low to $18,387 high.
The next major support is near the $17,000 zone. A downside break below the $17,000 support might call more losses. In the stated case, the price could decline towards the $16,500 support in the near term. Any more losses might stage a larger decline below the $16,000 level in the coming days.
Technical indicators:
Hourly MACD – The MACD is now gaining pace in the bearish zone.
Hourly RSI (Relative Strength Index) – The RSI for BTC/USD is now below the 50 level.
Major Support Levels – $17,250, followed by $17,000.
Major Resistance Levels – $17,650, $18,000 and $18,380.
Bitcoin price failed to clear $18,000 and corrected lower. BTC is signaling bearish signs and might even start a fresh decline in the coming sessions.
Bitcoin started a downward move and traded below the $17,600 support.
The price is trading below $17,500 and the 100 hourly simple moving average.
There was a break below a major bullish trend line with support near $17,620 on the hourly chart of the BTC/USD pair (data feed from Kraken).
The pair could continue to move lower unless it reclaims the 100 hourly SMA.
Bitcoin price attempted an upside break above the $18,400 zone resistance zone. BTC failed to stay above the $18,000 pivot level and reacted the downside.
A high was formed near $18,387 before the price started a fresh decline. There was a clear move below the $18,200 and $18,000 levels. The price declined below the 50% Fib retracement level of the key wave from the $16,881 low to $18,387 high.
Besides, there was a break below a major bullish trend line with support near $17,620 on the hourly chart of the BTC/USD pair. Bitcoin price is now below $17,500 and the 100 hourly simple moving average.
Source: BTCUSD on TradingView.com
On the upside, an immediate resistance is near the $17,500 level and the 100 hourly simple moving average. The first major resistance is near the $17,650 zone, above which the price may perhaps revisit the $18,000 zone. The next major resistance is near $18,380, above which the price might gain pace and rise towards the $19,000 level.
If bitcoin fails to clear the $17,650 resistance, there could be more downsides. An immediate support on the downside is near the $17,240 level. It is near the 76.4% Fib retracement level of the key wave from the $16,881 low to $18,387 high.
The next major support is near the $17,000 zone. A downside break below the $17,000 support might call more losses. In the stated case, the price could decline towards the $16,500 support in the near term. Any more losses might stage a larger decline below the $16,000 level in the coming days.
Technical indicators:
Hourly MACD – The MACD is now gaining pace in the bearish zone.
Hourly RSI (Relative Strength Index) – The RSI for BTC/USD is now below the 50 level.
Major Support Levels – $17,250, followed by $17,000.
Major Resistance Levels – $17,650, $18,000 and $18,380.
Tags: bitcoinbitcoin pricebtcusdBTCUSDTxbtusd
NewsBTCRead More
Spot ETFs had their strongest inflow day in two months, driven by funds other than…
Bearish traders lost $281 million in liquidations over 24 hours, nearly double the longs, as…
For readers tracking where the market is actually changing, this is the part that matters.…
The headline number is useful, but the real story is what it says about positioning.…
Bitcoin Magazine Bitcoin Exchange Inflows Spike to 49,000 BTC in a Day, Signaling More Volatility…
Bitcoin Magazine Wavespace Launches MiCA-Compliant Self-Custodial Bitcoin Debit Card Powered by Lightning and NWC Wavespace,…