Bitcoin price failed to clear $18,000 and corrected lower. BTC is signaling bearish signs and might even start a fresh decline in the coming sessions.
Bitcoin started a downward move and traded below the $17,600 support.
The price is trading below $17,500 and the 100 hourly simple moving average.
There was a break below a major bullish trend line with support near $17,620 on the hourly chart of the BTC/USD pair (data feed from Kraken).
The pair could continue to move lower unless it reclaims the 100 hourly SMA.
Bitcoin price attempted an upside break above the $18,400 zone resistance zone. BTC failed to stay above the $18,000 pivot level and reacted the downside.
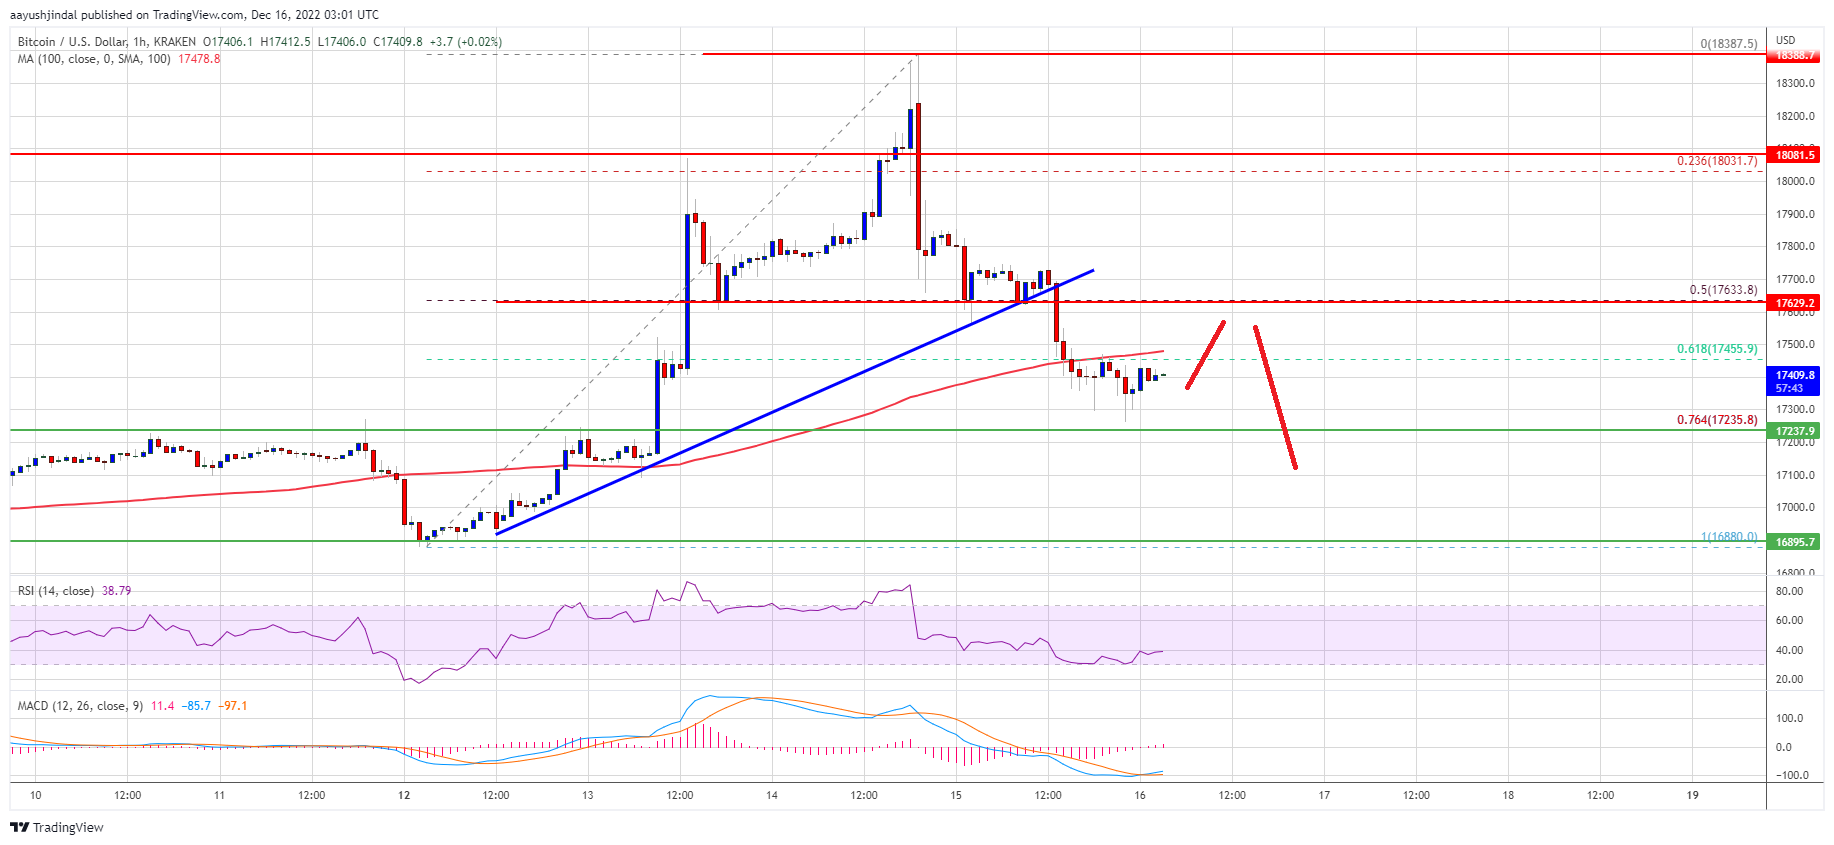
A high was formed near $18,387 before the price started a fresh decline. There was a clear move below the $18,200 and $18,000 levels. The price declined below the 50% Fib retracement level of the key wave from the $16,881 low to $18,387 high.
Besides, there was a break below a major bullish trend line with support near $17,620 on the hourly chart of the BTC/USD pair. Bitcoin price is now below $17,500 and the 100 hourly simple moving average.
Source: BTCUSD on TradingView.com
On the upside, an immediate resistance is near the $17,500 level and the 100 hourly simple moving average. The first major resistance is near the $17,650 zone, above which the price may perhaps revisit the $18,000 zone. The next major resistance is near $18,380, above which the price might gain pace and rise towards the $19,000 level.
If bitcoin fails to clear the $17,650 resistance, there could be more downsides. An immediate support on the downside is near the $17,240 level. It is near the 76.4% Fib retracement level of the key wave from the $16,881 low to $18,387 high.
The next major support is near the $17,000 zone. A downside break below the $17,000 support might call more losses. In the stated case, the price could decline towards the $16,500 support in the near term. Any more losses might stage a larger decline below the $16,000 level in the coming days.
Technical indicators:
Hourly MACD – The MACD is now gaining pace in the bearish zone.
Hourly RSI (Relative Strength Index) – The RSI for BTC/USD is now below the 50 level.
Major Support Levels – $17,250, followed by $17,000.
Major Resistance Levels – $17,650, $18,000 and $18,380.
Bitcoin price failed to clear $18,000 and corrected lower. BTC is signaling bearish signs and might even start a fresh decline in the coming sessions.
Bitcoin started a downward move and traded below the $17,600 support.
The price is trading below $17,500 and the 100 hourly simple moving average.
There was a break below a major bullish trend line with support near $17,620 on the hourly chart of the BTC/USD pair (data feed from Kraken).
The pair could continue to move lower unless it reclaims the 100 hourly SMA.
Bitcoin price attempted an upside break above the $18,400 zone resistance zone. BTC failed to stay above the $18,000 pivot level and reacted the downside.
A high was formed near $18,387 before the price started a fresh decline. There was a clear move below the $18,200 and $18,000 levels. The price declined below the 50% Fib retracement level of the key wave from the $16,881 low to $18,387 high.
Besides, there was a break below a major bullish trend line with support near $17,620 on the hourly chart of the BTC/USD pair. Bitcoin price is now below $17,500 and the 100 hourly simple moving average.
Source: BTCUSD on TradingView.com
On the upside, an immediate resistance is near the $17,500 level and the 100 hourly simple moving average. The first major resistance is near the $17,650 zone, above which the price may perhaps revisit the $18,000 zone. The next major resistance is near $18,380, above which the price might gain pace and rise towards the $19,000 level.
If bitcoin fails to clear the $17,650 resistance, there could be more downsides. An immediate support on the downside is near the $17,240 level. It is near the 76.4% Fib retracement level of the key wave from the $16,881 low to $18,387 high.
The next major support is near the $17,000 zone. A downside break below the $17,000 support might call more losses. In the stated case, the price could decline towards the $16,500 support in the near term. Any more losses might stage a larger decline below the $16,000 level in the coming days.
Technical indicators:
Hourly MACD – The MACD is now gaining pace in the bearish zone.
Hourly RSI (Relative Strength Index) – The RSI for BTC/USD is now below the 50 level.
Major Support Levels – $17,250, followed by $17,000.
Major Resistance Levels – $17,650, $18,000 and $18,380.
Tags: bitcoinbitcoin pricebtcusdBTCUSDTxbtusd
NewsBTCRead More
After declining to around $65,500 on Friday, Bitcoin appears to be recovering slowly this weekend.…
Bitcoin’s recent price action confirms a clear structural breakdown, ending weeks of compression and shifting…
Bitcoin is currently trading around $66,400, which is almost 48% below its all-time high of…
The price of Bitcoin succumbed to bearish pressure and fell to around $65,500 on Friday,…
A worst-case scenario is now on the table. Some analysts say Bitcoin could fall as…
Across many of the most well-known ecosystems like Bitcoin, Ethereum, and Solana, responses are diverging…