Bitcoin price gained pace and was able to clear $16,500. BTC must settle above $17,000 to start a real recovery in the near term.
Bitcoin started an upside correction and climbed above the $16,500 resistance.
The price is trading above $16,400 and the 100 hourly simple moving average.
There was a break above a major bearish trend line with resistance near $16,220 on the hourly chart of the BTC/USD pair (data feed from Kraken).
The pair could continue to rise if it settles above the $17,000 resistance zone.
Bitcoin price formed a decent support base above the $15,500 support zone. BTC remained well bid and started an upside correction above the $16,000 resistance.
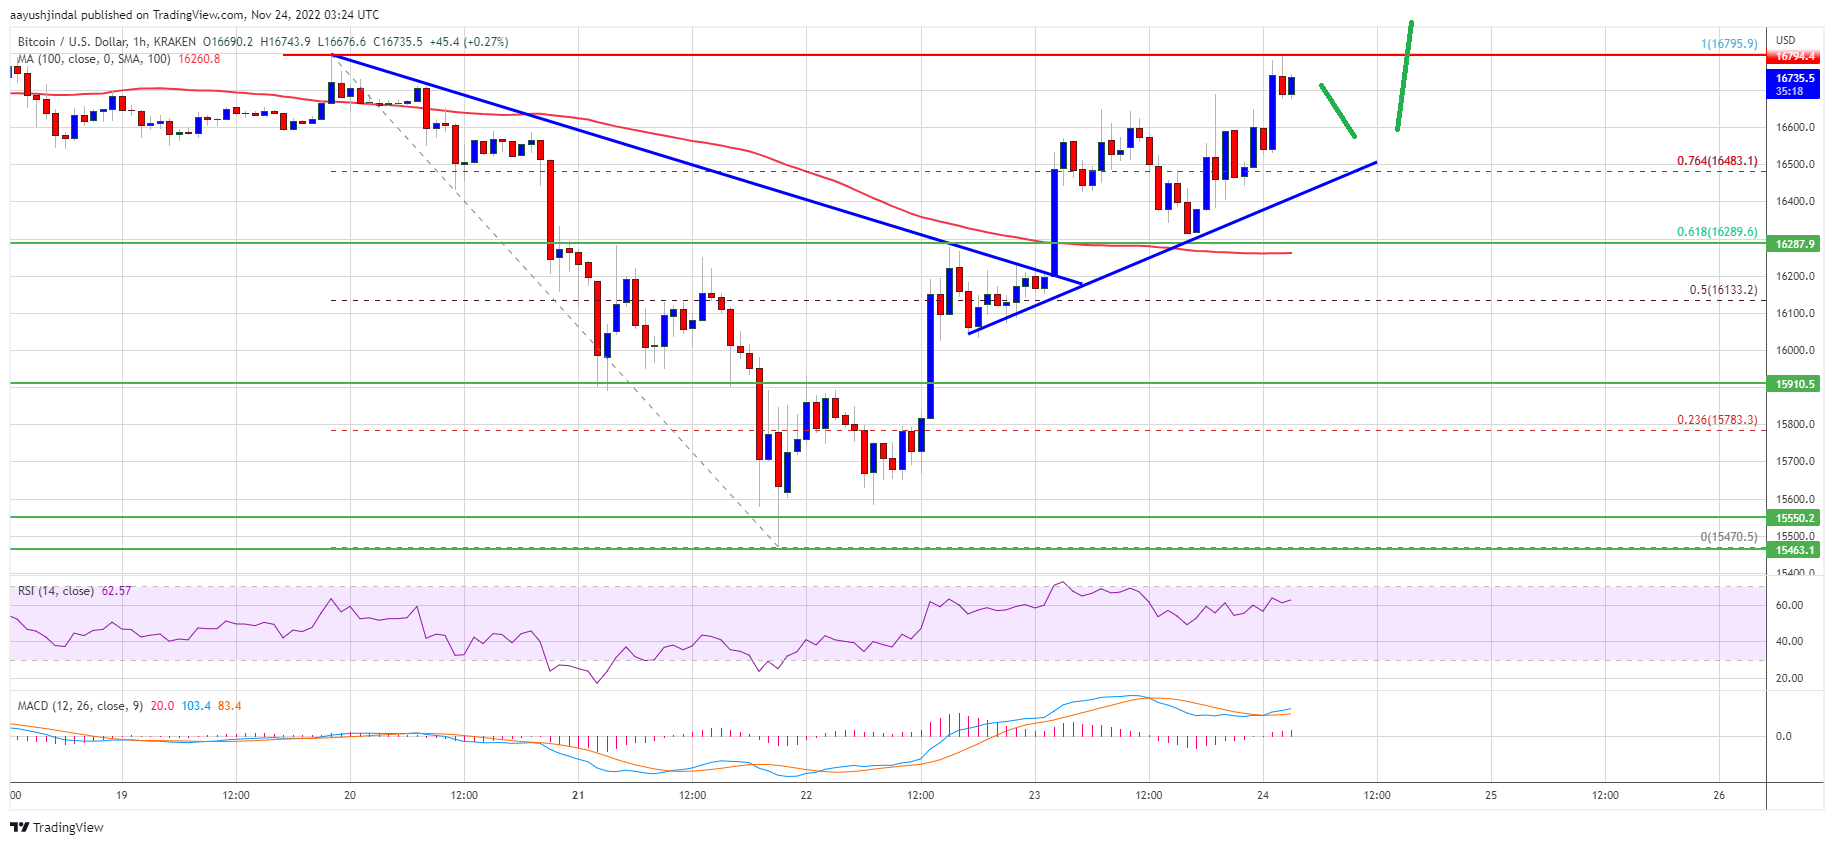
There was a clear move above the 50% Fib retracement level of the main drop from the $16,795 swing high to $15,470 low. Besides, there was a break above a major bearish trend line with resistance near $16,220 on the hourly chart of the BTC/USD pair.
Bitcoin price is now trading above $16,400 and the 100 hourly simple moving average. It is also well above the 76.4% Fib retracement level of the main drop from the $16,795 swing high to $15,470 low.
On the upside, an immediate resistance is near the $16,800 level. The first major resistance is near the $17,000 zone. A successful daily close above the $17,000 resistance might start a real recovery wave. The next major resistance is near $17,500, above which the price could gain pace for a move towards the $18,000 zone.
Source: BTCUSD on TradingView.com
An intermediate resistance could be $17,650. It is near the 1.618 Fib extension level of the main drop from the $16,795 swing high to $15,470 low.
If bitcoin fails to settle above the $17,000 resistance zone, it could start another decline. An immediate support on the downside is near the $16,500 level and a connecting bullish trend line on the same chart.
The next major support is near the $16,250 zone and the 100 hourly simple moving average, below which the price might gain bearish momentum. In the stated case, the price might drop towards the $15,500 support zone.
Technical indicators:
Hourly MACD – The MACD is now gaining pace in the bullish zone.
Hourly RSI (Relative Strength Index) – The RSI for BTC/USD is now above the 50 level.
Major Support Levels – $16,500, followed by $16,250.
Major Resistance Levels – $16,800, $17,000 and $18,000.
Bitcoin price gained pace and was able to clear $16,500. BTC must settle above $17,000 to start a real recovery in the near term.
Bitcoin started an upside correction and climbed above the $16,500 resistance.
The price is trading above $16,400 and the 100 hourly simple moving average.
There was a break above a major bearish trend line with resistance near $16,220 on the hourly chart of the BTC/USD pair (data feed from Kraken).
The pair could continue to rise if it settles above the $17,000 resistance zone.
Bitcoin price formed a decent support base above the $15,500 support zone. BTC remained well bid and started an upside correction above the $16,000 resistance.
There was a clear move above the 50% Fib retracement level of the main drop from the $16,795 swing high to $15,470 low. Besides, there was a break above a major bearish trend line with resistance near $16,220 on the hourly chart of the BTC/USD pair.
Bitcoin price is now trading above $16,400 and the 100 hourly simple moving average. It is also well above the 76.4% Fib retracement level of the main drop from the $16,795 swing high to $15,470 low.
On the upside, an immediate resistance is near the $16,800 level. The first major resistance is near the $17,000 zone. A successful daily close above the $17,000 resistance might start a real recovery wave. The next major resistance is near $17,500, above which the price could gain pace for a move towards the $18,000 zone.
Source: BTCUSD on TradingView.com
An intermediate resistance could be $17,650. It is near the 1.618 Fib extension level of the main drop from the $16,795 swing high to $15,470 low.
If bitcoin fails to settle above the $17,000 resistance zone, it could start another decline. An immediate support on the downside is near the $16,500 level and a connecting bullish trend line on the same chart.
The next major support is near the $16,250 zone and the 100 hourly simple moving average, below which the price might gain bearish momentum. In the stated case, the price might drop towards the $15,500 support zone.
Technical indicators:
Hourly MACD – The MACD is now gaining pace in the bullish zone.
Hourly RSI (Relative Strength Index) – The RSI for BTC/USD is now above the 50 level.
Major Support Levels – $16,500, followed by $16,250.
Major Resistance Levels – $16,800, $17,000 and $18,000.
Tags: bitcoinbitcoin pricebtcusdBTCUSDTxbtusd
NewsBTCRead More
BitMEX is facing a proposed class action in the Southern District of New York seeking…
Bitcoin Magazine Morgan Stanley Bitcoin ETF Nearly Notches $400M in Assets Wall Street giant Morgan…
Poolin Technology has filed for Chapter 11 bankruptcy protection, setting up an orderly wind-down and…
Bitcoin Magazine State Department to Debut Freedom Tech Program with Bitcoin Policy Institute, Palantir as…
Elliptic has published a new report explaining how Bitcoin ATM scams work, and the most…
Michael Saylor's Strategy — under continued pressure in this crypto bear market — released a…