Bitcoin price is slowly moving higher above the $16,750 resistance zone. BTC could gain bullish momentum if it settles above the $17,000 resistance zone.
Bitcoin is slowly gaining pace from the $16,350 and $16,000 support levels.
The price is trading above $16,500 and the 100 hourly simple moving average.
There was a break above a key bearish trend line with resistance near $16,600 on the hourly chart of the BTC/USD pair (data feed from Kraken).
The pair could start a steady increase if there is a close above the $17,000 resistance zone.
Bitcoin price corrected lower below the $16,600 and $16,500 levels. However, BTC remained well bid above the $16,350 support zone. A low was formed near $16,370 and the price started a slow recovery wave.
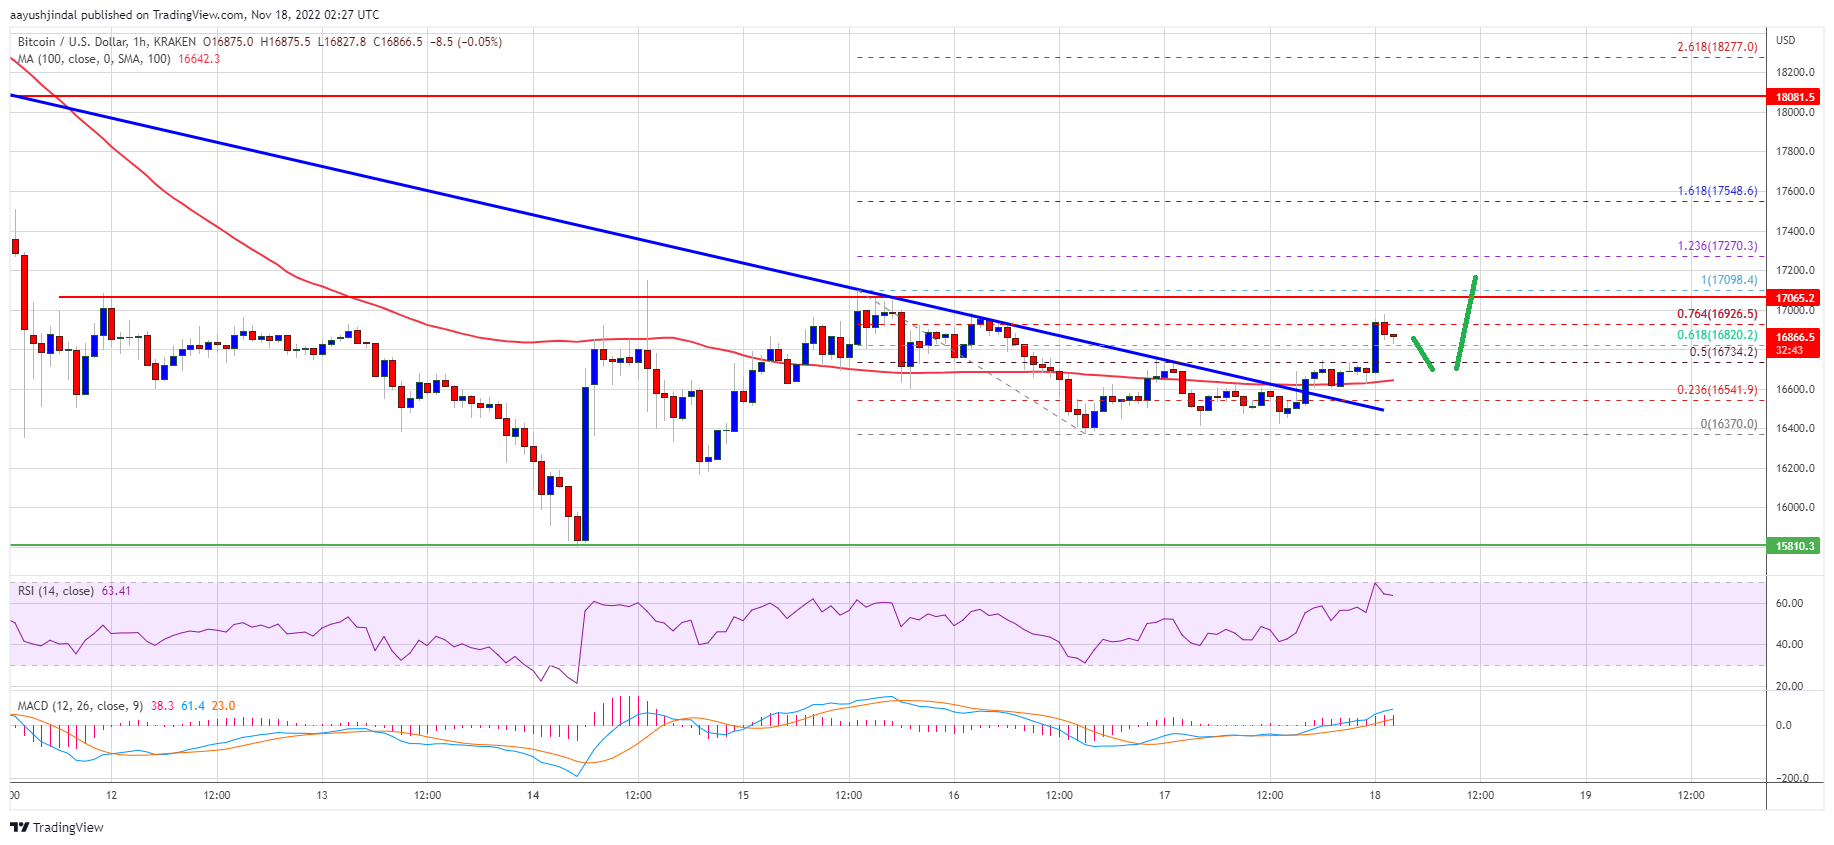
There was a move above the $16,500 and $16,600 resistance levels. The price cleared the 50% Fib retracement level of the recent decline from the $17,098 swing high to $16,370 low. Besides, there was a break above a key bearish trend line with resistance near $16,600 on the hourly chart of the BTC/USD pair.
Bitcoin price is now trading above $16,500 and the 100 hourly simple moving average. On the upside, an immediate resistance is near the $16,950 level. It is near the 76.4% Fib retracement level of the recent decline from the $17,098 swing high to $16,370 low.
Source: BTCUSD on TradingView.com
The first major resistance is near the $17,000 zone. A close above the $17,000 resistance could set the pace for a steady recovery wave. The next major resistance is near $17,500, above which the price could gain pace for a move towards the $18,000 zone.
If bitcoin fails to gain pace above the $17,000 resistance zone, it could start a fresh decline. An immediate support on the downside is near the $16,700 level and the 100 hourly SMA.
The next major support is near the $16,350 zone, below which the price might test the main support at $16,000. A clear move below the $16,000 support might send the price further lower.
Technical indicators:
Hourly MACD – The MACD is now gaining pace in the bullish zone.
Hourly RSI (Relative Strength Index) – The RSI for BTC/USD is now above the 50 level.
Major Support Levels – $16,350, followed by $16,000.
Major Resistance Levels – $17,000, $17,500 and $18,000.
Bitcoin price is slowly moving higher above the $16,750 resistance zone. BTC could gain bullish momentum if it settles above the $17,000 resistance zone.
Bitcoin is slowly gaining pace from the $16,350 and $16,000 support levels.
The price is trading above $16,500 and the 100 hourly simple moving average.
There was a break above a key bearish trend line with resistance near $16,600 on the hourly chart of the BTC/USD pair (data feed from Kraken).
The pair could start a steady increase if there is a close above the $17,000 resistance zone.
Bitcoin price corrected lower below the $16,600 and $16,500 levels. However, BTC remained well bid above the $16,350 support zone. A low was formed near $16,370 and the price started a slow recovery wave.
There was a move above the $16,500 and $16,600 resistance levels. The price cleared the 50% Fib retracement level of the recent decline from the $17,098 swing high to $16,370 low. Besides, there was a break above a key bearish trend line with resistance near $16,600 on the hourly chart of the BTC/USD pair.
Bitcoin price is now trading above $16,500 and the 100 hourly simple moving average. On the upside, an immediate resistance is near the $16,950 level. It is near the 76.4% Fib retracement level of the recent decline from the $17,098 swing high to $16,370 low.
Source: BTCUSD on TradingView.com
The first major resistance is near the $17,000 zone. A close above the $17,000 resistance could set the pace for a steady recovery wave. The next major resistance is near $17,500, above which the price could gain pace for a move towards the $18,000 zone.
If bitcoin fails to gain pace above the $17,000 resistance zone, it could start a fresh decline. An immediate support on the downside is near the $16,700 level and the 100 hourly SMA.
The next major support is near the $16,350 zone, below which the price might test the main support at $16,000. A clear move below the $16,000 support might send the price further lower.
Technical indicators:
Hourly MACD – The MACD is now gaining pace in the bullish zone.
Hourly RSI (Relative Strength Index) – The RSI for BTC/USD is now above the 50 level.
Major Support Levels – $16,350, followed by $16,000.
Major Resistance Levels – $17,000, $17,500 and $18,000.
Tags: bitcoin price
NewsBTCRead More
Bitcoin Magazine David Bailey Confirmed As A Bitcoin 2026 Speaker David Bailey has been officially…
Bitcoin Magazine Paraguay Adopts Stricter Crypto Oversight, Mandates Detailed Transaction on Bitcoin Reporting Paraguay’s National…
Bitcoin Magazine Policy Group Calls for Bitcoin Inclusion in Proposed Crypto Tax Exemption The Bitcoin…
Bitcoin Magazine Corporate Bitcoin Holdings Hit Record High as Institutions Accumulate 2.8x Mining Supply: Report…
Research shows that only 8% to 10% of global Bitcoin hashrate runs in oil-sensitive power…
Today’s quantum computers are far from breaking Bitcoin’s cryptography and any real threat would likely…