Bitcoin price declined further below the $55,000 support zone. BTC is down over 15% and might even slide toward the $50,000 zone.
Bitcoin gained bearish momentum below the $56,500 and $55,000 support levels.
The price is trading below $55,000 and the 100 hourly Simple moving average.
There is a connecting bearish trend line forming with resistance at $56,700 on the hourly chart of the BTC/USD pair (data feed from Kraken).
The pair might start a decent recovery wave if it clears the $58,000 resistance zone.
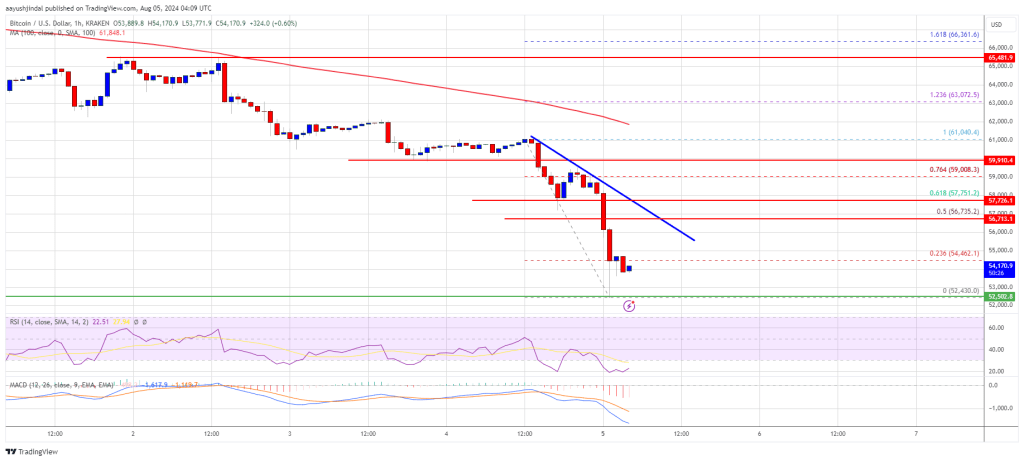
Bitcoin price extended losses below the $56,500 support zone. BTC even traded below the $55,000 and $54,500 levels. A low is formed near $52,430 and the price is now consolidating losses.
It recovered above the $53,500 level and tested the 23.6% Fib retracement level of the downward move from the $61,040 swing high to the $52,430 low. However, the price is now struggling to clear the $55,000 resistance zone. There is also a connecting bearish trend line forming with resistance at $56,700 on the hourly chart of the BTC/USD pair.
Bitcoin price is trading below $55,000 and the 100 hourly Simple moving average. On the upside, the price could face resistance near the $55,500 level. The first key resistance is near the $56,800 level.
A clear move above the $56,800 resistance might send the price further higher in the coming sessions. The next key resistance could be $58,000 or the 61.8% Fib retracement level of the downward move from the $61,040 swing high to the $52,430 low.
The next major hurdle sits at $58,800. A close above the $58,800 resistance might spark bullish moves. In the stated case, the price could rise and test the $60,000 resistance.
If Bitcoin fails to recover above the $56,800 resistance zone, it could start another decline. Immediate support on the downside is near the $53,000 level.
The first major support is $52,500. The next support is now near $52,000. Any more losses might send the price toward the $50,000 support zone in the near term.
Technical indicators:
Hourly MACD – The MACD is now gaining pace in the bearish zone.
Hourly RSI (Relative Strength Index) – The RSI for BTC/USD is now below the 30 level.
Major Support Levels – $53,000, followed by $52,500.
Major Resistance Levels – $56,800, and $58,000.
[#item_full_content]NewsBTCRead MoreBitcoin Magazine Wavespace Launches MiCA-Compliant Self-Custodial Bitcoin Debit Card Powered by Lightning and NWC Wavespace,…
For readers tracking where the market is actually changing, this is the part that matters.…
The headline number is useful, but the real story is what it says about positioning.…
Miners must redirect their hashrate before the July 31 cutoff, as the pool will stop…
The Nasdaq-listed Korean media company once lined up $1 billion in financing to buy 10,000…
The bank said Strategy's bitcoin sales policy adds avoidable market uncertainty and should be replaced…