Bitcoin price gained over 10% and broke the $64,000 resistance level. BTC is showing positive signs and might attempt to move above the $65,000 level.
Bitcoin gained bullish momentum above the $63,500 resistance zone.
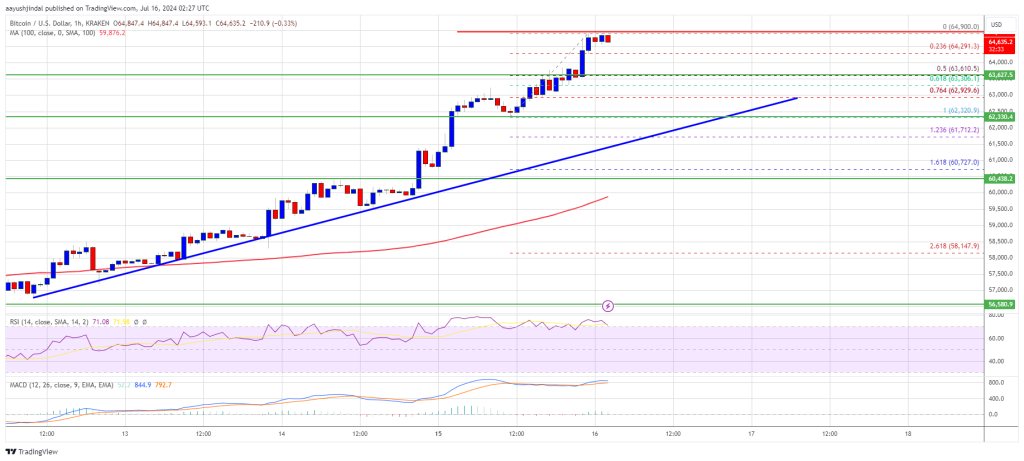
The price is trading above $63,500 and the 100 hourly Simple moving average.
There is a major bullish trend line forming with support at $62,200 on the hourly chart of the BTC/USD pair (data feed from Kraken).
The pair might continue to move up if it breaks the $65,000 resistance.
Bitcoin price started a major increase above the $61,500 and $62,000 resistance levels. BTC even cleared the $63,500 resistance to move further into a positive zone. The bulls pushed the price toward the $65,000 zone.
A high was formed at $64,900 and the price is now consolidating gains. It is trading well above the 23.6% Fib retracement level of the upward move from the $62,320 swing low to the $64,900 high. There is also a major bullish trend line forming with support at $62,200 on the hourly chart of the BTC/USD pair.
Bitcoin price is now trading above $64,000 and the 100 hourly Simple moving average. If there is an upside continuation, the price could face resistance near the $64,800 level. The first key resistance is near the $65,000 level.
A clear move above the $65,000 resistance might start a decent increase in the coming sessions. The next key resistance could be $66,200. The next major hurdle sits at $66,500. A close above the $66,500 resistance might start a steady increase and send the price higher. In the stated case, the price could rise and test the $67,000 resistance.
If Bitcoin fails to climb above the $65,000 resistance zone, it could start a downside correction. Immediate support on the downside is near the $64,250 level.
The first major support is $63,650 and the 50% Fib retracement level of the upward move from the $62,320 swing low to the $64,900 high. The next support is now near $62,500. Any more losses might send the price toward the $61,500 support zone in the near term.
Technical indicators:
Hourly MACD – The MACD is now gaining pace in the bullish zone.
Hourly RSI (Relative Strength Index) – The RSI for BTC/USD is now above the 50 level.
Major Support Levels – $64,250, followed by $63,650.
Major Resistance Levels – $65,000, and $66,200.
[#item_full_content]NewsBTCRead MoreBitcoin is facing a critical juncture as its macro retracement converges with a tight mid-range…
Onchain data shows multiple cost basis metrics confirm heavy demand and investor conviction around the…
Bitcoin’s bearish momentum has since reached a cool-off state, as price maintains above the last…
Executive John Ameriks emphasized Vanguard's core view of the crypto sector hasn't changed, seeing the…
The recommendation is in line with other global asset managers like BlackRock and Bank of…
The Bitcoin market is experiencing a gradual trend reversal following weeks of prolonged price correction…