Bitcoin price started a fresh declined below the $100,000 zone. BTC is down close to 10% and might test the $90,000 support zone.
Bitcoin started a fresh decline below the $100,000 level.
The price is trading below $99,500 and the 100 hourly Simple moving average.
There is a key bearish trend line forming with resistance at $96,200 on the hourly chart of the BTC/USD pair (data feed from Kraken).
The pair could start another increase if it stays above the $90,000 zone.
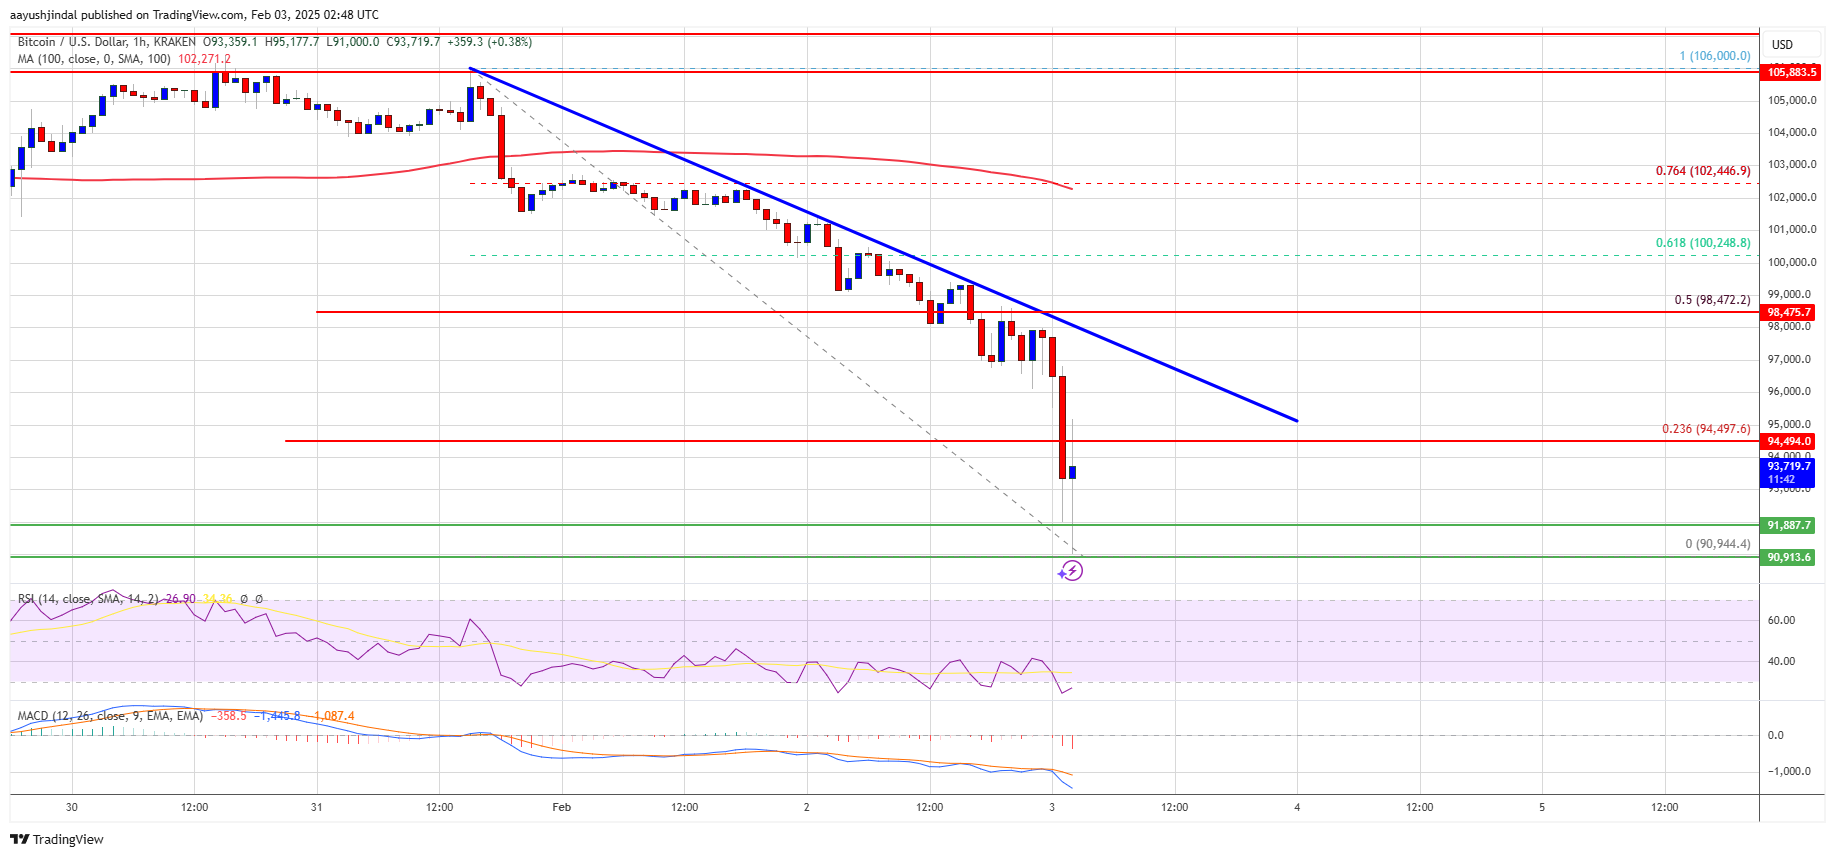
Bitcoin price started another decline below the $100,000 zone. BTC gained bearish momentum for a move below the $98,000 and $95,000 levels. It even dived below $93,000.
A low was formed at $90,944 and the price is now consolidating losses. There was a minor increase above the $92,500 level. The price even tested the 23.6% Fib retracement level of the downward move from the $106,000 swing high to the $90,944 low. However, the bears are now active near the $95,000 zone.
Bitcoin price is now trading below $95,000 and the 100 hourly Simple moving average. On the upside, immediate resistance is near the $95,000 level. The first key resistance is near the $96,500 level. There is also a key bearish trend line forming with resistance at $96,200 on the hourly chart of the BTC/USD pair.
The next key resistance could be $98,400 or the 50% Fib retracement level of the downward move from the $106,000 swing high to the $90,944 low. A close above the $98,500 resistance might send the price further higher. In the stated case, the price could rise and test the $96,800 resistance level. Any more gains might send the price toward the $100,000 level.
If Bitcoin fails to rise above the $95,000 resistance zone, it could start a fresh decline. Immediate support on the downside is near the $92,500 level. The first major support is near the $92,000 level.
The next support is now near the $90,000 zone. Any more losses might send the price toward the $88,500 support in the near term.
Technical indicators:
Hourly MACD – The MACD is now gaining pace in the bearish zone.
Hourly RSI (Relative Strength Index) – The RSI for BTC/USD is now below the 50 level.
Major Support Levels – $92,500, followed by $90,000.
Major Resistance Levels – $95,000 and $96,500.
[#item_full_content]NewsBTCRead MoreDespite the crypto market’s renewed weakness on Thursday, a new AI-driven market model produced by…
The recent price action echoes the November–January pattern, showing weak conviction among the “buy the…
Morgan Stanley has filed to launch a spot Bitcoin ETF with the ticker MSBT and…
Oil prices slipped as major economies announced joint efforts to stabilize energy markets.Read MoreCoinDesk: Bitcoin,…
BTQ Technologies moved a key Bitcoin (BTC) security proposal from theory to practice on Thursday,…
Bitcoin price started a sharp decline from well above $73,000. BTC is now consolidating and…