Bitcoin price is up over 10% and surging toward $58,000. BTC is signaling a strong upward trend and might surge toward the $60,000 resistance.
Bitcoin price is gaining pace above the $55,000 resistance zone.
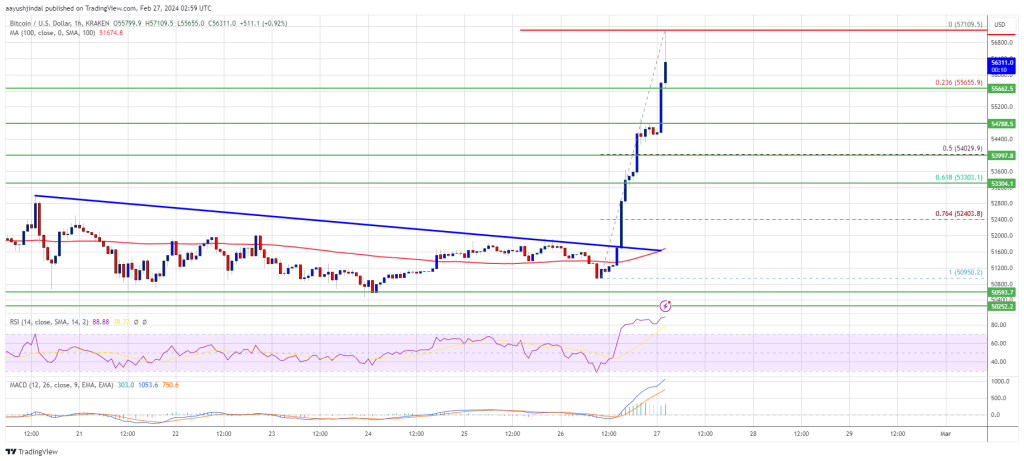
The price is trading above $55,000 and the 100 hourly Simple moving average.
There was a break above a major bearish trend line with resistance at $51,600 on the hourly chart of the BTC/USD pair (data feed from Kraken).
The pair could extend its current rally toward the $60,000 resistance zone.
Bitcoin price remained well-bid above the $50,500 support zone. A support base was formed above the $51,500 level and the price started a fresh rally. BTC gained bullish momentum after it broke the $51,600 and $52,000 resistance levels.
There was a break above a major bearish trend line with resistance at $51,600 on the hourly chart of the BTC/USD pair. The pair surged over 10% and broke many hurdles near the $55,000 level. A new multi-week high is formed near $57,109 and the price is now retreating.
Bitcoin is still trading above $55,000 and the 100 hourly Simple moving average. It is also above the 23.6% Fib retracement level of the recent rally from the $50,950 swing low to the $57,109 high.
Source: BTCUSD on TradingView.com
Immediate resistance is near the $56,800 level. The next key resistance could be $57,000, above which the price could rise toward the $58,000 resistance zone. If the bulls remain in action, the price could even surpass $58,000 and test $58,800. The main hurdle for them is visible near the $60,000 zone.
If Bitcoin fails to rise above the $57,000 resistance zone, it could start a downside correction. Immediate support on the downside is near the $56,000 level.
The first major support is $55,600. If there is a close below $55,600, the price could start a decent pullback toward the 50% Fib retracement level of the recent rally from the $50,950 swing low to the $57,109 high. Any more losses might send the price toward the $53,200 support zone.
Technical indicators:
Hourly MACD – The MACD is now gaining pace in the bullish zone.
Hourly RSI (Relative Strength Index) – The RSI for BTC/USD is now above the 50 level.
Major Support Levels – $56,000, followed by $55,600.
Major Resistance Levels – $57,000, $58,000, and $60,000.
[#item_full_content]NewsBTCRead MoreThe founder of CryptoQuant has explained that Bitcoin is not “pumpable” right now based on…
Bitcoin price started a recovery wave above $68,500. BTC is now struggling to clear $72,000…
Bitcoin’s latest drawdown from its all-time high is being compared to 2022 across crypto Twitter…
Scaramucci noted that SkyBridge has been purchasing bitcoin at various price points, including around $84,000,…
Bitcoin’s mining landscape is showing clear signs of stress as network difficulty records its largest…
The Bitcoin and Ethereum prices have rebounded from last week’s lows, providing optimism that the…