Bitcoin price is eyeing more gains above the $73,000 resistance. BTC is setting up for a move toward the $75,000 resistance in the near term.
Bitcoin price is showing positive signs and eyeing more gains above the $73,000 zone.
The price is trading above $72,500 and the 100 hourly Simple moving average.
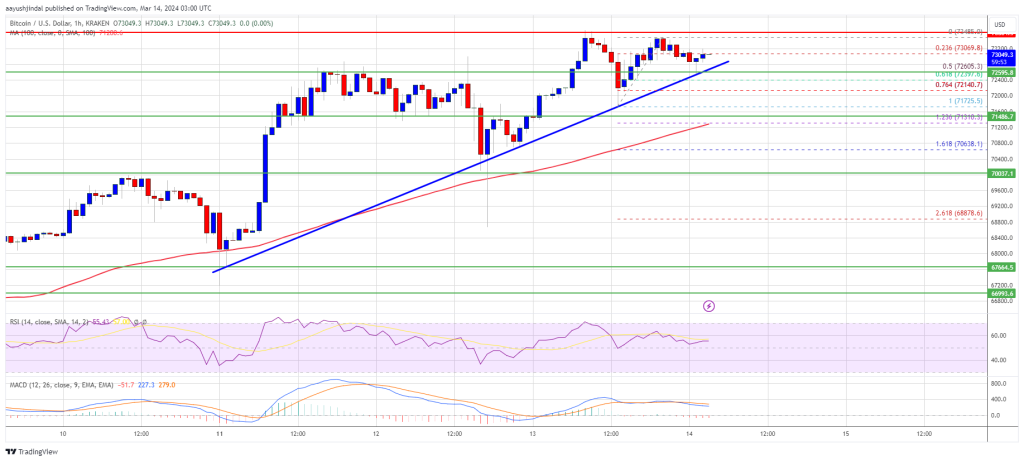
There is a connecting bullish trend line forming with support at $72,800 on the hourly chart of the BTC/USD pair (data feed from Kraken).
The pair could continue to move up if it clears the $73,450 and $73,500 resistance levels.
Bitcoin price remained well-bid above the $72,000 level. BTC formed a base and started a fresh increase above the $72,500 resistance. The price even broke the $73,000 level.
It traded to a new all-time high above $73,500 before there was a downside correction. The price declined below the $73,000 and $72,500 levels. A low was formed near $71,725 and the price is again rising. There was a move above the $73,000 level.
Bitcoin is now trading above $72,500 and the 100 hourly Simple moving average. It is holding gains above the 50% Fib retracement level of the upward move from the $71,725 swing low to the $73,485 high.
Source: BTCUSD on TradingView.com
Immediate resistance is near the $73,200 level. The next key resistance could be $73,500, above which the price could rise toward the $74,200 resistance zone. If there is a clear move above the $74,200 resistance zone, the price could even attempt a move above the $75,000 resistance zone. Any more gains might send the price toward the $76,500 level.
If Bitcoin fails to rise above the $73,500 resistance zone, it could start a downside correction. Immediate support on the downside is near the $72,800 level and the trend line.
The first major support is $72,150 or 76.4% Fib retracement level of the upward move from the $71,725 swing low to the $73,485 high. If there is a close below $72,150, the price could start a decent pullback toward the $70,000 level. Any more losses might send the price toward the $68,500 support zone.
Technical indicators:
Hourly MACD – The MACD is now gaining pace in the bullish zone.
Hourly RSI (Relative Strength Index) – The RSI for BTC/USD is now above the 50 level.
Major Support Levels – $72,800, followed by $72,150.
Major Resistance Levels – $73,200, $73,500, and $75,000.
[#item_full_content]NewsBTCRead MoreAccording to a new forecast from an Elliott Wave analyst, the Bitcoin price could be…
In a sign of the growing convergence between traditional finance and digital assets, Emirates NBD…
Crypto rebounds sharply from Tuesday's lows, yet traders question whether the move marks a lasting…
Bitcoin Magazine Morgan Stanley Has Future Plans for Bitcoin Trading, Lending, and Custody Morgan Stanley…
Peter Schiff has a number. And he wants everyone to see it. The longtime gold…
Cited in the 2008 Bitcoin white paper, Back argued volatility is typical even as regulatory…