Bitcoin price is slowly losing momentum and struggling below $70,000. BTC is now consolidating and facing hurdles near the $69,500 resistance zone.
Bitcoin is facing many key hurdles near the $70,000 zone.
The price is trading above $69,500 and the 100 hourly Simple moving average.
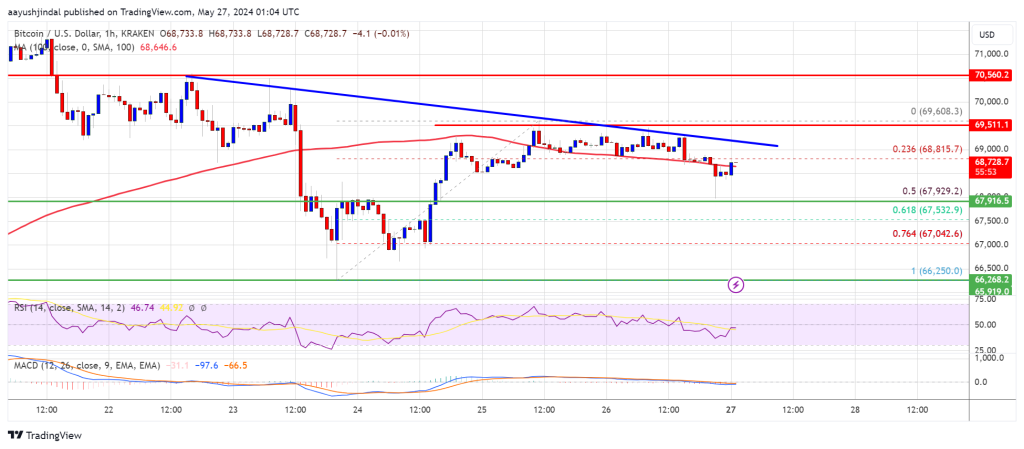
There is a key bearish trend line forming with resistance at $69,100 on the hourly chart of the BTC/USD pair (data feed from Kraken).
The pair could continue to move down if it stays below the $70,000 zone.
Bitcoin price found support above the $66,000 level and started another increase. BTC was able to clear the $68,000 resistance zone. However, the bears were active near the $69,500 and $70,000 levels.
A high was formed near $69,608 and the price is now correcting gains. There was a move below the 23.6% Fib retracement level of the upward move from the $66,250 swing low to the $69,608 high. It even tested the $68,000 support zone.
The bulls are now active near the 50% Fib retracement level of the upward move from the $66,250 swing low to the $69,608 high. Bitcoin price is trading above $69,500 and the 100 hourly Simple moving average.
If there is a fresh increase, the price might face resistance near the $69,000 level. There is also a key bearish trend line forming with resistance at $69,100 on the hourly chart of the BTC/USD pair. The first major resistance could be $69,500.
The next key resistance could be $70,000. A clear move above the $70,000 resistance might send the price higher. In the stated case, the price could rise and test the $71,200 resistance. Any more gains might send BTC toward the $72,000 resistance.
If Bitcoin fails to climb above the $69,500 resistance zone, it could continue to move down. Immediate support on the downside is near the $68,000 level.
The first major support is $67,500. The next support is now forming near $67,000. Any more losses might send the price toward the $65,500 support zone in the near term.
Technical indicators:
Hourly MACD – The MACD is now losing pace in the bearish zone.
Hourly RSI (Relative Strength Index) – The RSI for BTC/USD is now below the 50 level.
Major Support Levels – $67,500, followed by $67,000.
Major Resistance Levels – $69,100, and $69,500.
[#item_full_content]NewsBTCRead MoreAccording to market analyst Darkfost, Bitcoin’s price-based supply distribution is revealing critical zones that could…
Jurrien Timmer, director of global macro at Fidelity Investments, says strong earnings are helping markets…
The current price range of Bitcoin may not relay much, but a change in ownership…
Key factors, such as ETF flows, macro factors and on-chain supply favor a rally in…
"Effective immediately, the United States Navy ... will begin the process of blockading any and…
Bitcoin traded as high as $73,000 following a 9% price rally in the past week.…