Bitcoin price started a fresh decline below $90,000. BTC is consolidating losses and remains at risk of more losses if it dips below $88,000.
Bitcoin started a sharp decline below $92,000 and $90,000.
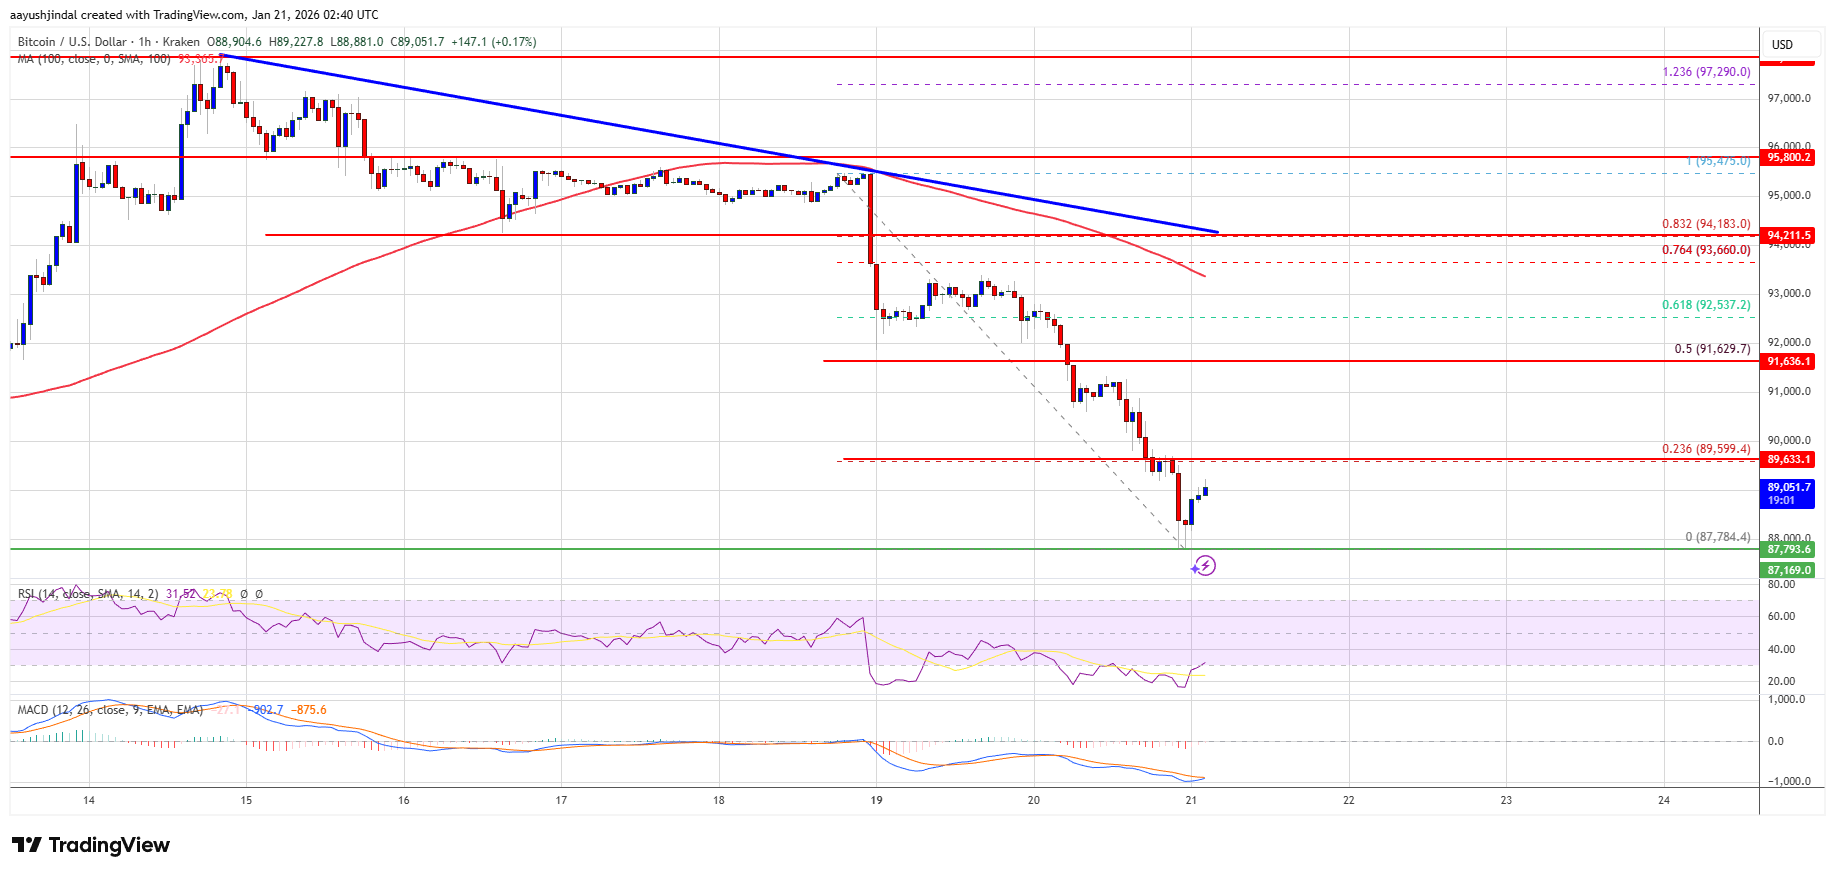
The price is trading below $90,000 and the 100 hourly Simple moving average.
There is a bearish trend line forming with resistance at $94,200 on the hourly chart of the BTC/USD pair (data feed from Kraken).
The pair might continue to move down if it stays below the $92,000 zone.
Bitcoin price failed to stay above the $92,500 support and started a fresh decline. BTC declined sharply below the $91,000 and $90,500 support levels.
The bears even pushed the price below $90,000. A low was formed at $87,784, and the price is now consolidating losses. There was a minor recovery wave above $88,500, but the price stayed below the 23.6% Fib retracement level of the recent decline from the $95,475 swing high to the $87,784 low.
Bitcoin is now trading below $90,000 and the 100 hourly Simple moving average. If the price remains stable above $88,000, it could attempt a fresh increase. Immediate resistance is near the $89,600 level. The first key resistance is near the $90,000 level.
The next resistance could be $91,650 or the 50% Fib retracement level of the recent decline from the $95,475 swing high to the $87,784 low. A close above the $91,650 resistance might send the price further higher. In the stated case, the price could rise and test the $92,000 resistance.
Any more gains might send the price toward the $94,000 level. There is also a bearish trend line forming with resistance at $94,200 on the hourly chart of the BTC/USD pair. The next barrier for the bulls could be $95,000 and $95,500.
If Bitcoin fails to rise above the $91,650 resistance zone, it could start another decline. Immediate support is near the $88,800 level. The first major support is near the $88,000 level.
The next support is now near the $87,500 zone. Any more losses might send the price toward the $86,200 support in the near term. The main support sits at $85,000, below which BTC might accelerate lower in the near term.
Technical indicators:
Hourly MACD – The MACD is now gaining pace in the bearish zone.
Hourly RSI (Relative Strength Index) – The RSI for BTC/USD is now below the 50 level.
Major Support Levels – $88,800, followed by $88,000.
Major Resistance Levels – $91,650 and $92,000.
[#item_full_content]NewsBTCRead MoreCryptos bounced on Trump’s five-day pause announcement, but the next move hinges on whether tensions…
Market expert Ali Martinez recently revealed on X (formerly Twitter) what he describes as “the…
Bitcoin’s recent price stagnation reflects a market grappling with uncertainty, and confidence being tested not…
Bitcoin Magazine Bitcoin Swings Wildly as Iran Ceasefire Drama Rocks Crypto Markets Bitcoin kicked off…
Crypto analyst Celal has predicted that the Bitcoin price could hit a new all-time high…
Bitcoin is once again testing a critical level that could shape its next major move.…