Bitcoin price remained well bid above the $16,920 support. BTC climbed higher and might soon aim an upside break above the $17,500 resistance zone.
Bitcoin found a strong buying interest near the $16,920 and $16,900 levels.
The price is trading above $17,000 and the 100 hourly simple moving average.
There is a major contracting triangle forming with resistance near $17,220 on the hourly chart of the BTC/USD pair (data feed from Kraken).
The pair could gain bullish momentum if it clears the $17,250 and $17,450 resistance levels.
Bitcoin price corrected lower from the $17,292 swing high. BTC declined below the $17,000 level and the 100 hourly simple moving average.
However, the bulls were active near the $16,920 and $16,900 levels. A low was formed near $16,880 and the price started a fresh increase. There was a clear move above the $17,000 resistance zone and the 100 hourly simple moving average.
Bitcoin price is now consolidating gains near the $17,150 level. There was a minor decline below the 23.6% Fib retracement level of the recent increase from the $16,880 low to $17,247 high.
On the upside, an immediate resistance is near the $17,150 level. There is also a major contracting triangle forming with resistance near $17,220 on the hourly chart of the BTC/USD pair. The first major resistance is near the $17,300 zone, above which the price may perhaps revisit the $17,450 zone.
The next major resistance is near $17,500, above which the price start a steady increase and rise towards the $18,000 zone in the near term.
If bitcoin fails to clear the $17,150 resistance, there could be a fresh decline. An immediate support on the downside is near the $17,120 level and the 100 hourly simple moving average.
The next major support is near the $17,000 zone. It is near the 50% Fib retracement level of the recent increase from the $16,880 low to $17,247 high. A downside break below the $17,000 support might call a drop towards $16,880. Any more losses might push the price towards the $16,500 zone in the near term.
Technical indicators:
Hourly MACD – The MACD is now losing pace in the bullish zone.
Hourly RSI (Relative Strength Index) – The RSI for BTC/USD is now above the 50 level.
Major Support Levels – $17,000, followed by $16,880.
Major Resistance Levels – $17,150, $17,300 and $17,450.
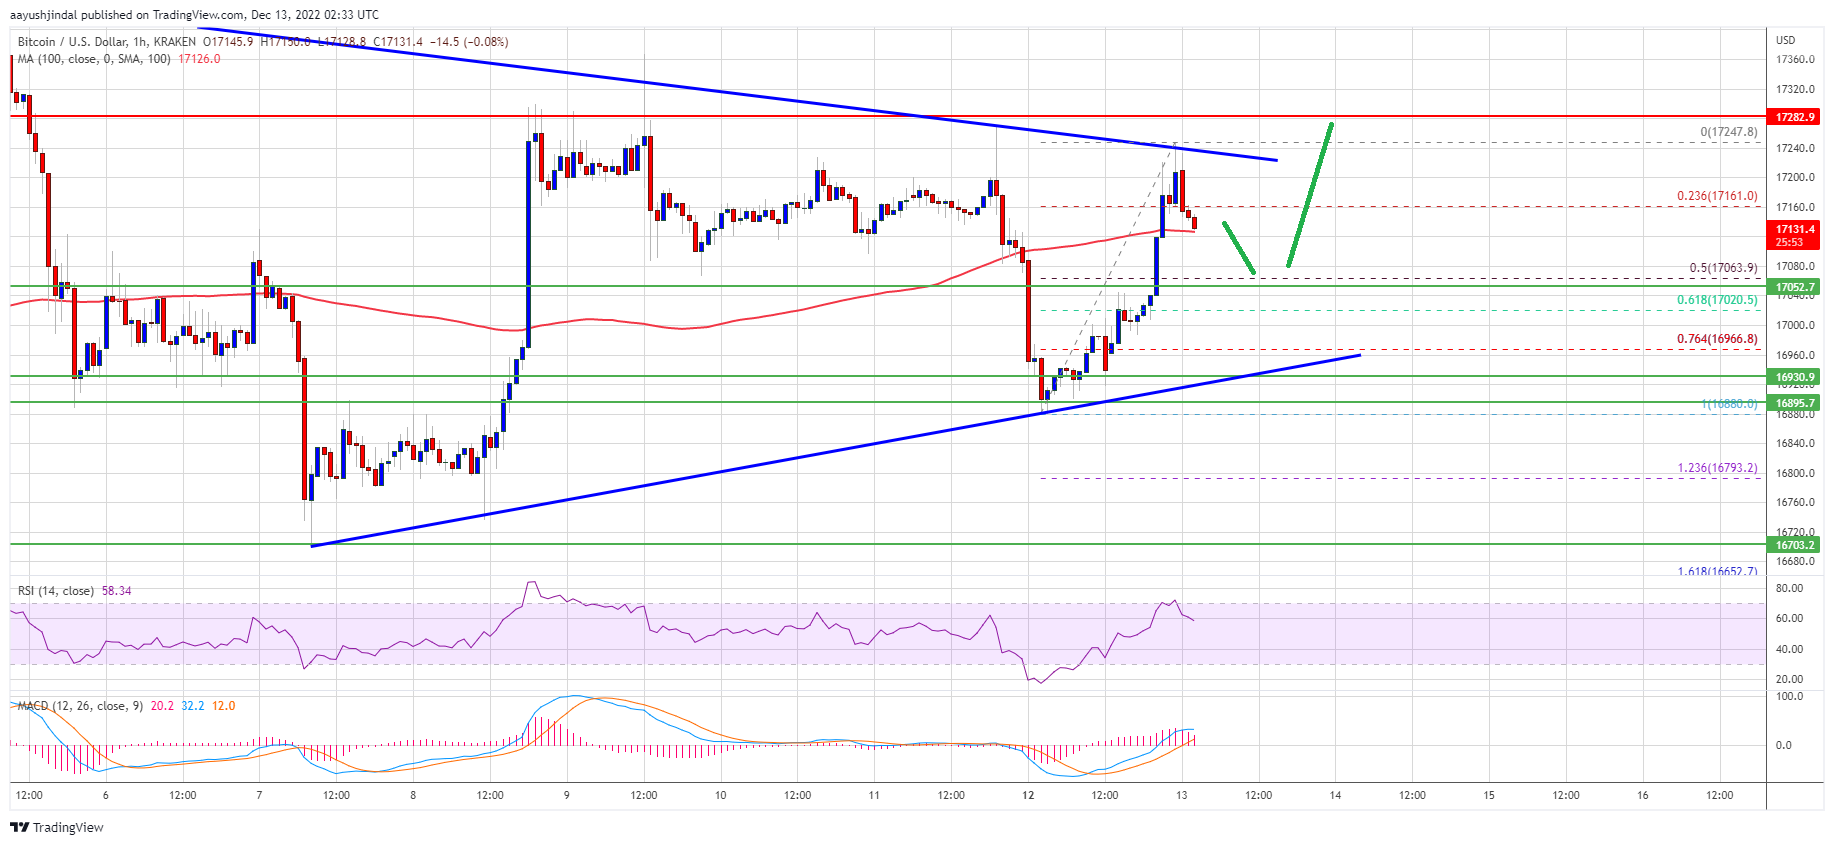
Bitcoin price remained well bid above the $16,920 support. BTC climbed higher and might soon aim an upside break above the $17,500 resistance zone.
Bitcoin found a strong buying interest near the $16,920 and $16,900 levels.
The price is trading above $17,000 and the 100 hourly simple moving average.
There is a major contracting triangle forming with resistance near $17,220 on the hourly chart of the BTC/USD pair (data feed from Kraken).
The pair could gain bullish momentum if it clears the $17,250 and $17,450 resistance levels.
Bitcoin price corrected lower from the $17,292 swing high. BTC declined below the $17,000 level and the 100 hourly simple moving average.
However, the bulls were active near the $16,920 and $16,900 levels. A low was formed near $16,880 and the price started a fresh increase. There was a clear move above the $17,000 resistance zone and the 100 hourly simple moving average.
Bitcoin price is now consolidating gains near the $17,150 level. There was a minor decline below the 23.6% Fib retracement level of the recent increase from the $16,880 low to $17,247 high.
On the upside, an immediate resistance is near the $17,150 level. There is also a major contracting triangle forming with resistance near $17,220 on the hourly chart of the BTC/USD pair. The first major resistance is near the $17,300 zone, above which the price may perhaps revisit the $17,450 zone.
Source: BTCUSD on TradingView.com
The next major resistance is near $17,500, above which the price start a steady increase and rise towards the $18,000 zone in the near term.
If bitcoin fails to clear the $17,150 resistance, there could be a fresh decline. An immediate support on the downside is near the $17,120 level and the 100 hourly simple moving average.
The next major support is near the $17,000 zone. It is near the 50% Fib retracement level of the recent increase from the $16,880 low to $17,247 high. A downside break below the $17,000 support might call a drop towards $16,880. Any more losses might push the price towards the $16,500 zone in the near term.
Technical indicators:
Hourly MACD – The MACD is now losing pace in the bullish zone.
Hourly RSI (Relative Strength Index) – The RSI for BTC/USD is now above the 50 level.
Major Support Levels – $17,000, followed by $16,880.
Major Resistance Levels – $17,150, $17,300 and $17,450.
Tags: bitcoinbitcoin pricebtcusdBTCUSDTxbtusd
NewsBTCRead More
Data shows the Bitcoin perpetual futures market has seen a negative Funding Rate recently, suggesting…
Despite the crypto market’s renewed weakness on Thursday, a new AI-driven market model produced by…
The recent price action echoes the November–January pattern, showing weak conviction among the “buy the…
Morgan Stanley has filed to launch a spot Bitcoin ETF with the ticker MSBT and…
Oil prices slipped as major economies announced joint efforts to stabilize energy markets.Read MoreCoinDesk: Bitcoin,…
BTQ Technologies moved a key Bitcoin (BTC) security proposal from theory to practice on Thursday,…