Bitcoin price struggled to clear the $20,000 resistance zone against the US Dollar. BTC might decline, but there is a key support waiting near the $18,900 zone.
Bitcoin failed to gain momentum for a move above the $20,000 resistance zone.
The price is trading below $19,400 and the 100 hourly simple moving average.
There is a key bearish trend line forming with resistance near $19,250 on the hourly chart of the BTC/USD pair (data feed from Kraken).
The pair could move down further to test the $18,900 support zone in the near term.
Bitcoin Price Trims Gains
Bitcoin price attempted a decent increase above the $19,500 resistance zone. BTC even climbed above the $19,800 level, but the bears were active near the $20,000 resistance zone.
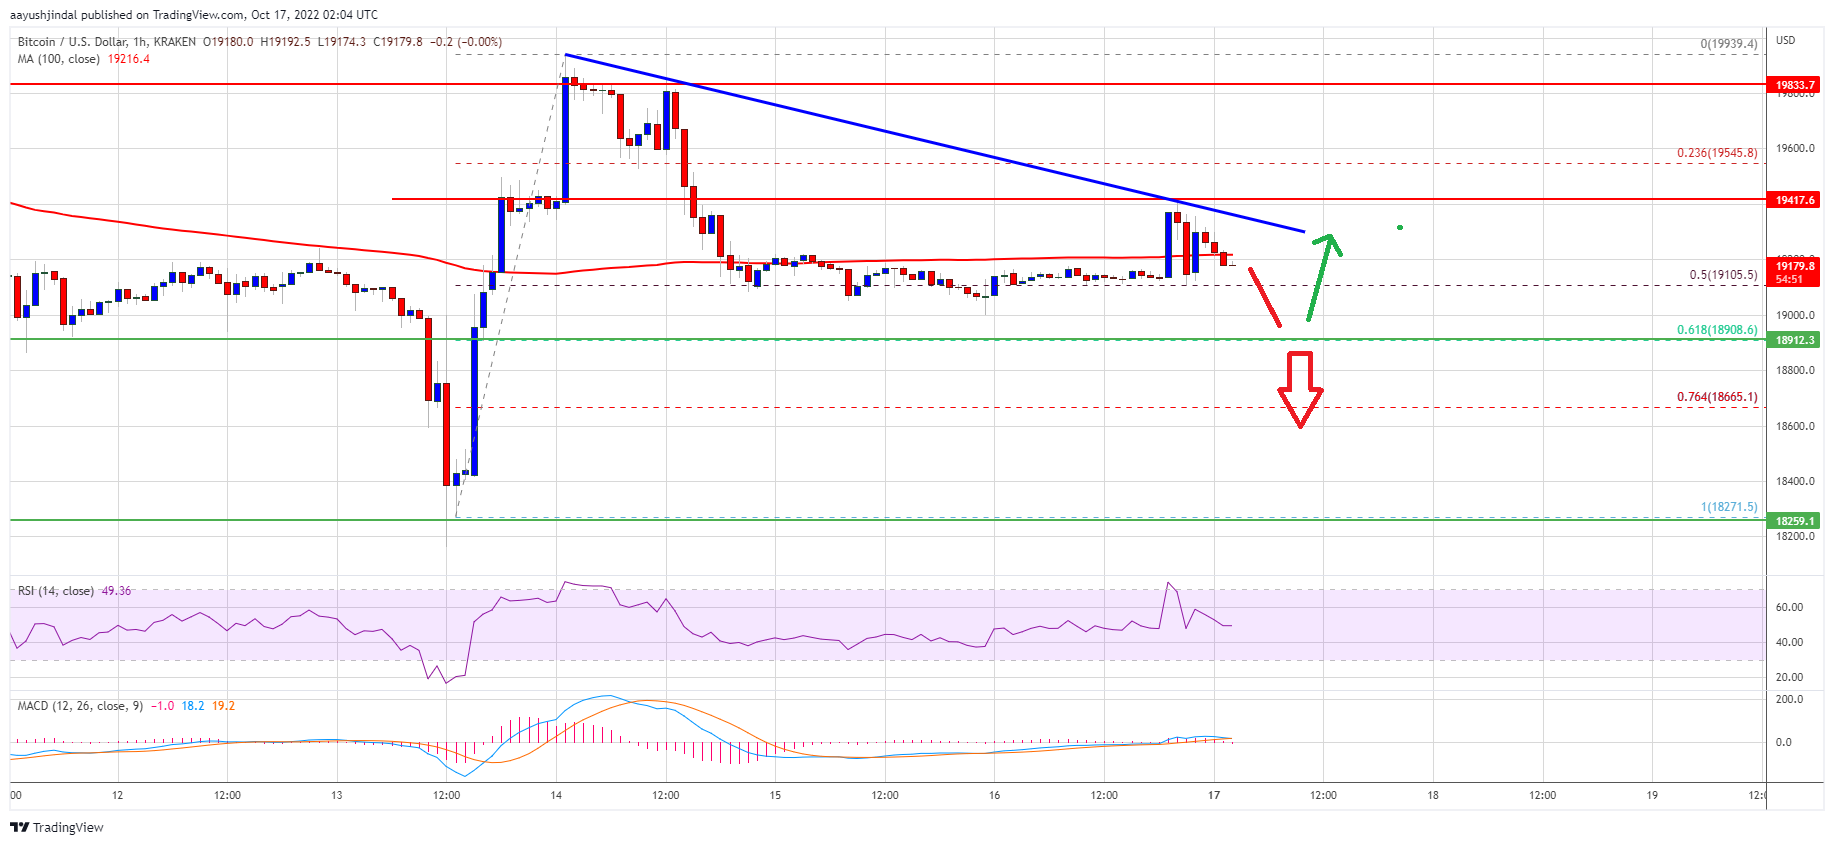
The price traded as high as $19,939 before there was a fresh decline. There was a drop below the $19,500 and $19,400 levels. The bears even pushed the price below the 50% Fib retracement level of the upward move from the $18,271 swing low to $19,939 high.
Bitcoin price is now trading below $19,400 and the 100 hourly simple moving average. There is also a key bearish trend line forming with resistance near $19,250 on the hourly chart of the BTC/USD pair.
On the upside, an immediate resistance is near the $19,220 level. The first major resistance sits near the $19,250 level and the trend line. A clear move above the trend line resistance might pump the price towards the $19,500 resistance zone.
Source: BTCUSD on TradingView.com
The main resistance is still near the $20,000 zone. Any more gains might start a steady increase towards the $21,200 resistance zone.
Dips Limited in BTC?
If bitcoin fails to rise above the $19,250 resistance zone, it could continue to move down. An immediate support on the downside is near the $19,000 zone.
The next major support is near the $18,900 zone. It is near the 61.8% Fib retracement level of the upward move from the $18,271 swing low to $19,939 high. A downside break below the $18,900 support zone might increase selling pressure. In the stated case, the price could decline towards the $18,500 support zone.
Technical indicators:
Hourly MACD – The MACD is now gaining pace in the bearish zone.
Hourly RSI (Relative Strength Index) – The RSI for BTC/USD is now near the 50 level.
Major Support Levels – $19,000, followed by $18,900.
Major Resistance Levels – $19,250, $19,500 and $20,000.
Bitcoin price struggled to clear the $20,000 resistance zone against the US Dollar. BTC might decline, but there is a key support waiting near the $18,900 zone.
Bitcoin failed to gain momentum for a move above the $20,000 resistance zone.
The price is trading below $19,400 and the 100 hourly simple moving average.
There is a key bearish trend line forming with resistance near $19,250 on the hourly chart of the BTC/USD pair (data feed from Kraken).
The pair could move down further to test the $18,900 support zone in the near term.
Bitcoin price attempted a decent increase above the $19,500 resistance zone. BTC even climbed above the $19,800 level, but the bears were active near the $20,000 resistance zone.
The price traded as high as $19,939 before there was a fresh decline. There was a drop below the $19,500 and $19,400 levels. The bears even pushed the price below the 50% Fib retracement level of the upward move from the $18,271 swing low to $19,939 high.
Bitcoin price is now trading below $19,400 and the 100 hourly simple moving average. There is also a key bearish trend line forming with resistance near $19,250 on the hourly chart of the BTC/USD pair.
On the upside, an immediate resistance is near the $19,220 level. The first major resistance sits near the $19,250 level and the trend line. A clear move above the trend line resistance might pump the price towards the $19,500 resistance zone.
Source: BTCUSD on TradingView.com
The main resistance is still near the $20,000 zone. Any more gains might start a steady increase towards the $21,200 resistance zone.
If bitcoin fails to rise above the $19,250 resistance zone, it could continue to move down. An immediate support on the downside is near the $19,000 zone.
The next major support is near the $18,900 zone. It is near the 61.8% Fib retracement level of the upward move from the $18,271 swing low to $19,939 high. A downside break below the $18,900 support zone might increase selling pressure. In the stated case, the price could decline towards the $18,500 support zone.
Technical indicators:
Hourly MACD – The MACD is now gaining pace in the bearish zone.
Hourly RSI (Relative Strength Index) – The RSI for BTC/USD is now near the 50 level.
Major Support Levels – $19,000, followed by $18,900.
Major Resistance Levels – $19,250, $19,500 and $20,000.
Tags: bitcoinbtcusdBTCUSDTxbtusd
NewsBTCRead More
On-chain analytics firm Glassnode has explained how a flip in Bitcoin short-term holder profitability could…
A crypto analyst is calling for a $40,000 Bitcoin price surge within 60 days, and…
As Bitcoin (BTC) seeks to solidify its position around $71,000, the cryptocurrency faces a challenge…
Bitcoin and crypto exchanges built much of the cryptocurrency industry’s reputation by challenging traditional finance.…
Bitcoin Magazine AI Pivot Won’t Save Everyone, Wintermute Tells Bitcoin Miners Bitcoin miners are caught…
Bitcoin Magazine South African Eskom Considering Discount Power for Bitcoin Miners as Solar Creates Surplus…