Bitcoin price is attempting an upside break above $16,800. BTC could gain bullish momentum if it clears the $16,800 and $17,000 levels.
Bitcoin is still trading in a major range below the $16,800 and $17,000 resistance levels.
The price is trading above $16,600 and the 100 hourly simple moving average.
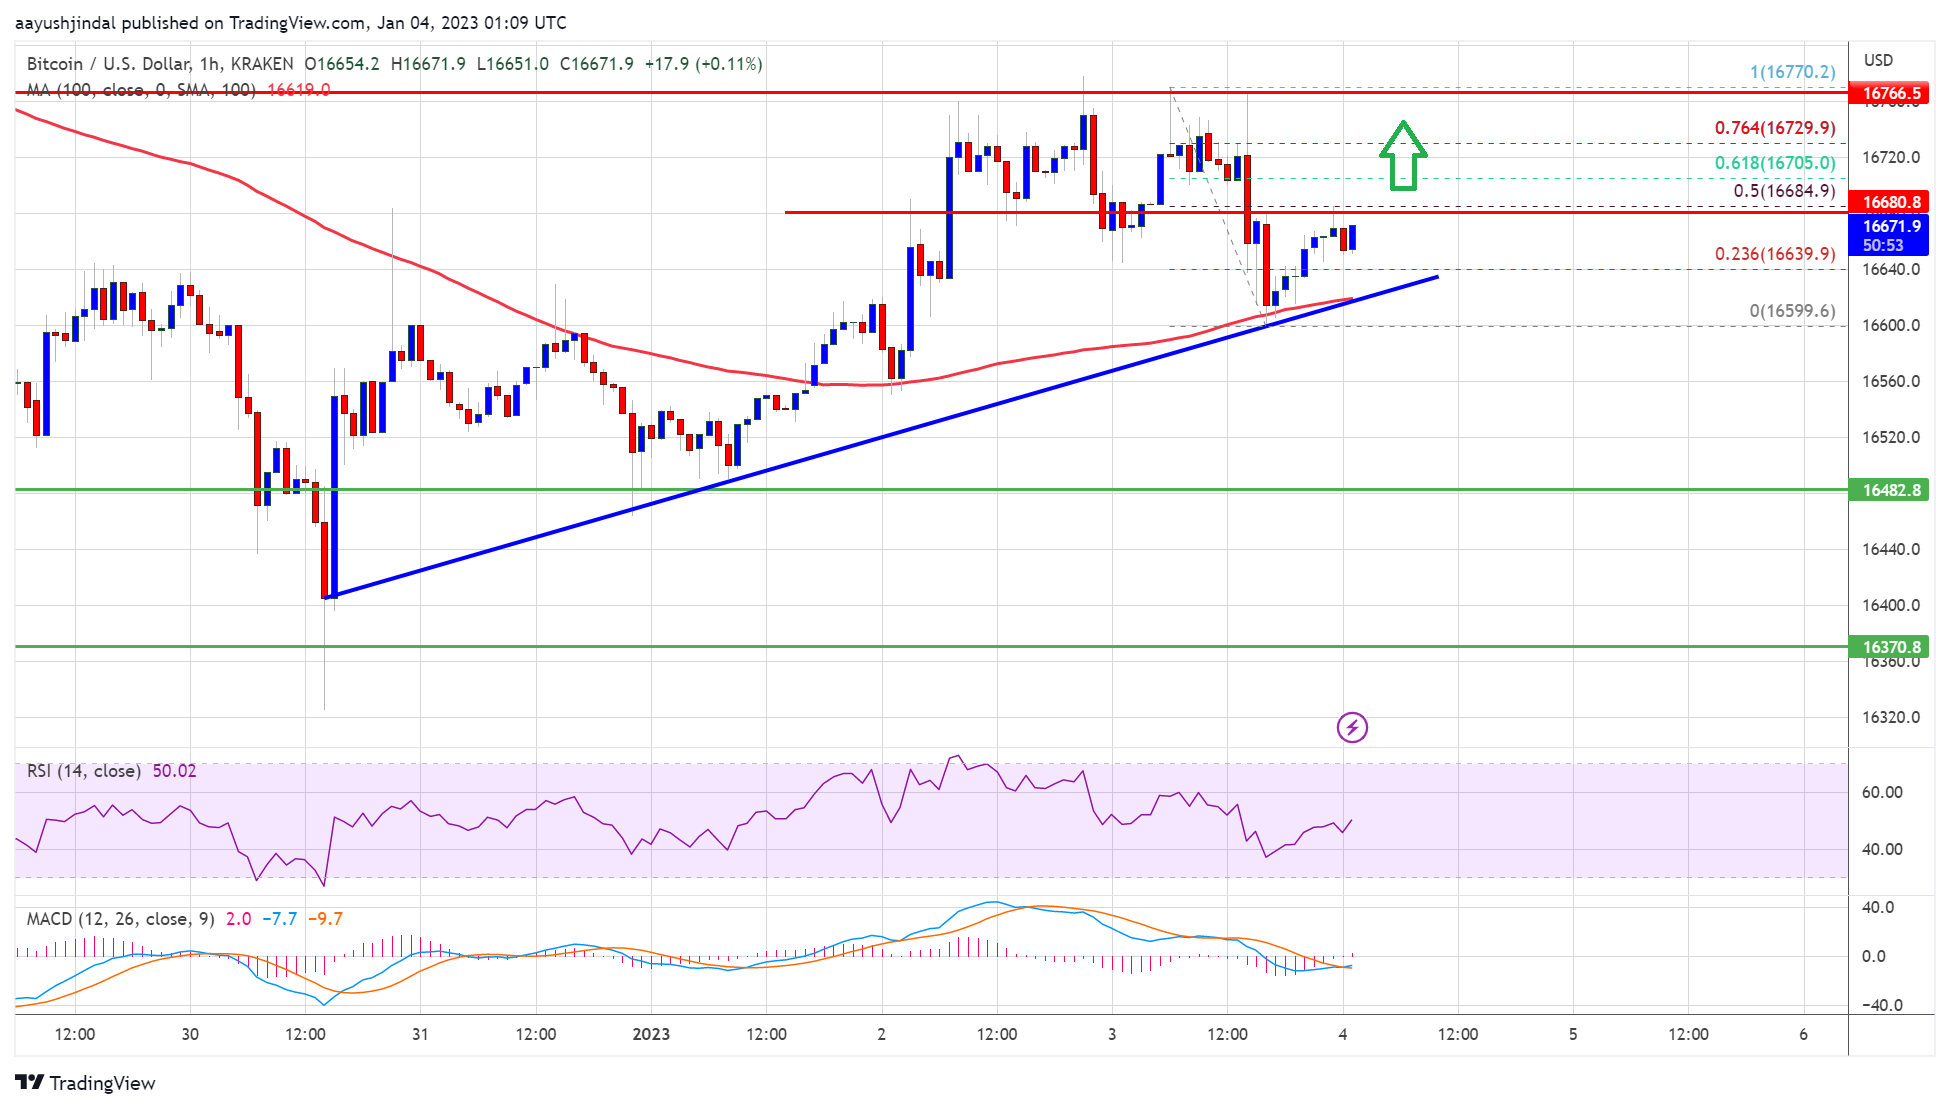
There is a key bullish trend line forming with support near $16,620 on the hourly chart of the BTC/USD pair (data feed from Kraken).
The pair could gain bullish momentum if it settles above the $16,800 resistance.
Bitcoin price formed a base above the $16,350 support zone. BTC started a slow increase and was able to clear the $16,650 resistance zone. The price even spiked towards the $16,800 resistance zone.
However, there was no upside break above $16,800. A high was formed near $16,770 and the price started a downside correction. There was a drop below the $16,700 level, but the bulls are active above the $16,600 level.
Bitcoin price is now trading above $16,600 and the 100 hourly simple moving average. There is also a key bullish trend line forming with support near $16,620 on the hourly chart of the BTC/USD pair. On the upside, an immediate resistance is near the $16,685 level.
The 50% Fib retracement level of the recent decline from the $16,770 swing high to $16,599 low is also near the $16,685 level. The first major resistance is near the $16,700 zone.
Source: BTCUSD on TradingView.com
The 61.8% Fib retracement level of the recent decline from the $16,770 swing high to $16,599 low is also near the $16,700 level. The next major resistance is near the $16,800 level. The main barrier is still near the $17,000 level. A clear close above the $17,000 resistance might start a fresh increase in the near term.
If bitcoin price fails to surpass the $16,800 resistance, it could start another decline. An immediate support on the downside is near the $16,620 level and the trend line.
The next major support is near the $16,500 level. A clear move below the $16,500 support might send the price towards the $16,350 level. Any more losses might send the price towards $16,000.
Technical indicators:
Hourly MACD – The MACD is now gaining pace in the bullish zone.
Hourly RSI (Relative Strength Index) – The RSI for BTC/USD is now above the 50 level.
Major Support Levels – $16,500, followed by $16,350.
Major Resistance Levels – $16,700, $16,800 and $17,000.
Bitcoin price is attempting an upside break above $16,800. BTC could gain bullish momentum if it clears the $16,800 and $17,000 levels.
Bitcoin is still trading in a major range below the $16,800 and $17,000 resistance levels.
The price is trading above $16,600 and the 100 hourly simple moving average.
There is a key bullish trend line forming with support near $16,620 on the hourly chart of the BTC/USD pair (data feed from Kraken).
The pair could gain bullish momentum if it settles above the $16,800 resistance.
Bitcoin price formed a base above the $16,350 support zone. BTC started a slow increase and was able to clear the $16,650 resistance zone. The price even spiked towards the $16,800 resistance zone.
However, there was no upside break above $16,800. A high was formed near $16,770 and the price started a downside correction. There was a drop below the $16,700 level, but the bulls are active above the $16,600 level.
Bitcoin price is now trading above $16,600 and the 100 hourly simple moving average. There is also a key bullish trend line forming with support near $16,620 on the hourly chart of the BTC/USD pair. On the upside, an immediate resistance is near the $16,685 level.
The 50% Fib retracement level of the recent decline from the $16,770 swing high to $16,599 low is also near the $16,685 level. The first major resistance is near the $16,700 zone.
Source: BTCUSD on TradingView.com
The 61.8% Fib retracement level of the recent decline from the $16,770 swing high to $16,599 low is also near the $16,700 level. The next major resistance is near the $16,800 level. The main barrier is still near the $17,000 level. A clear close above the $17,000 resistance might start a fresh increase in the near term.
If bitcoin price fails to surpass the $16,800 resistance, it could start another decline. An immediate support on the downside is near the $16,620 level and the trend line.
The next major support is near the $16,500 level. A clear move below the $16,500 support might send the price towards the $16,350 level. Any more losses might send the price towards $16,000.
Technical indicators:
Hourly MACD – The MACD is now gaining pace in the bullish zone.
Hourly RSI (Relative Strength Index) – The RSI for BTC/USD is now above the 50 level.
Major Support Levels – $16,500, followed by $16,350.
Major Resistance Levels – $16,700, $16,800 and $17,000.
Tags: bitcoinbitcoin pricebtcusdBTCUSDTxbtusd
NewsBTCRead More
The vast majority of the activity was concentrated in BlackRock’s IBIT product accounting for nearly…
Your day-ahead look for July 27, 2026Read MoreCoinDesk: Bitcoin, Ethereum, Crypto News and Price Data[#item_full_content]
CoinEx's Jeff Ko sees bitcoin staying range-bound near $65,000 while retreating oil, a 4.7% 10-year…
ETH outperforms BTC, hinting at potential altcoin rally, as the U.S. and Iran hold fire…
BitMEX is facing a proposed class action in the Southern District of New York seeking…
Bitcoin Magazine Morgan Stanley Bitcoin ETF Nearly Notches $400M in Assets Wall Street giant Morgan…