Bitcoin price spiked toward $30,000 after fake news about spot ETF hit the market. BTC is now consolidating above $28,200 and could rise toward $29,200.
Bitcoin is holding gains above the $28,000 and $28,200 levels.
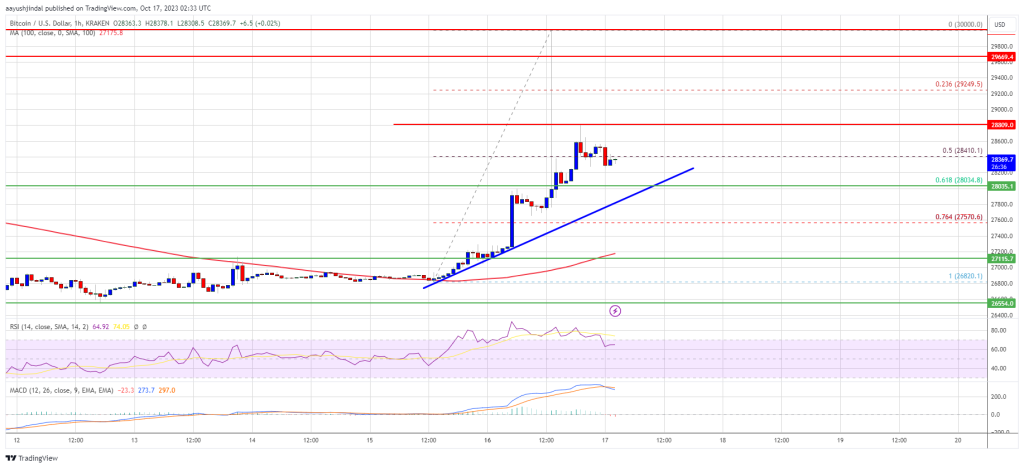
The price is trading above $28,200 and the 100 hourly Simple moving average.
There is a key bullish trend line forming with support near $28,000 on the hourly chart of the BTC/USD pair (data feed from Kraken).
The pair could start a fresh increase if there is a clear move above the $28,800 resistance.
Bitcoin price started a strong increase above the $27,500 resistance zone. BTC saw a wild increase after fake news about the spot ETF approval hit the market.
There was a nasty increase above the $28,500 resistance. The price even spiked toward $30,000 before trimming gains. There was a drop below the $29,200 and $28,800 support levels. The price even declined below the 50% Fib retracement level of the upward move from the $26,820 swing low to the $30,000 high.
Bitcoin price is now trading above $28,200 and the 100 hourly Simple moving average. There is also a key bullish trend line forming with support near $28,000 on the hourly chart of the BTC/USD pair. The trend line is near the 61.8% Fib retracement level of the upward move from the $26,820 swing low to the $30,000 high.
On the upside, immediate resistance is near the $28,600 level. The next key resistance could be near $28,800. A clear move above the $28,600 and $28,800 resistance levels could set the pace for a larger increase. The next key resistance could be $29,200.
Source: BTCUSD on TradingView.com
A close above the $29,200 resistance might start a steady increase toward the $29,500 level. Any more gains might send BTC toward the $30,000 level.
If Bitcoin fails to rise above the $28,800 resistance zone, it could slide further. Immediate support on the downside is near the $28,000 level and the trend line zone.
The next major support is near the $27,800 level. A downside break and close below the $27,800 support might send the price further lower. The next support sits at $27,200 and the 100 hourly Simple moving average.
Technical indicators:
Hourly MACD – The MACD is now gaining pace in the bullish zone.
Hourly RSI (Relative Strength Index) – The RSI for BTC/USD is now above the 50 level.
Major Support Levels – $28,000, followed by $27,800.
Major Resistance Levels – $28,600, $28,800, and $29,200.
[#item_full_content]NewsBTCRead MoreIran's government is reportedly reviewing Pakistan's request for a two-week ceasefire positively, according to an…
Bitcoin Magazine Paolo Ardoino Confirmed as a Bitcoin 2026 Speaker Paolo Ardoino has been officially…
A 33-day dry spell for solo Bitcoin miners ended last week when one small operator…
Crypto analyst Kabuki has explained why the Bitcoin rainbow chart shows that the price range…
Bitcoin Magazine Even a 1% Bitcoin Allocation Can Drastically Reshape Portfolio Risk, Schwab Finds A…
The asset manager's research arm argues the technical path to quantum-safe blockchains is clear but…