Bitcoin price started a downside correction from $21,000 against the US Dollar. BTC is stable above $20,000 and might start a fresh increase.
Bitcoin is holding gains above the $20,000 and $20,200 levels.
The price is trading above $20,000 and the 100 hourly simple moving average.
There is a key bearish trend line forming with resistance near $20,440 on the hourly chart of the BTC/USD pair (data feed from Kraken).
The pair could start another upward move if there is a clear move above the $20,500 resistance.
Bitcoin price started a fresh increase above the $20,000 and $20,500 resistance levels. BTC even traded above the $20,800 level and tested the $21,000 resistance zone.
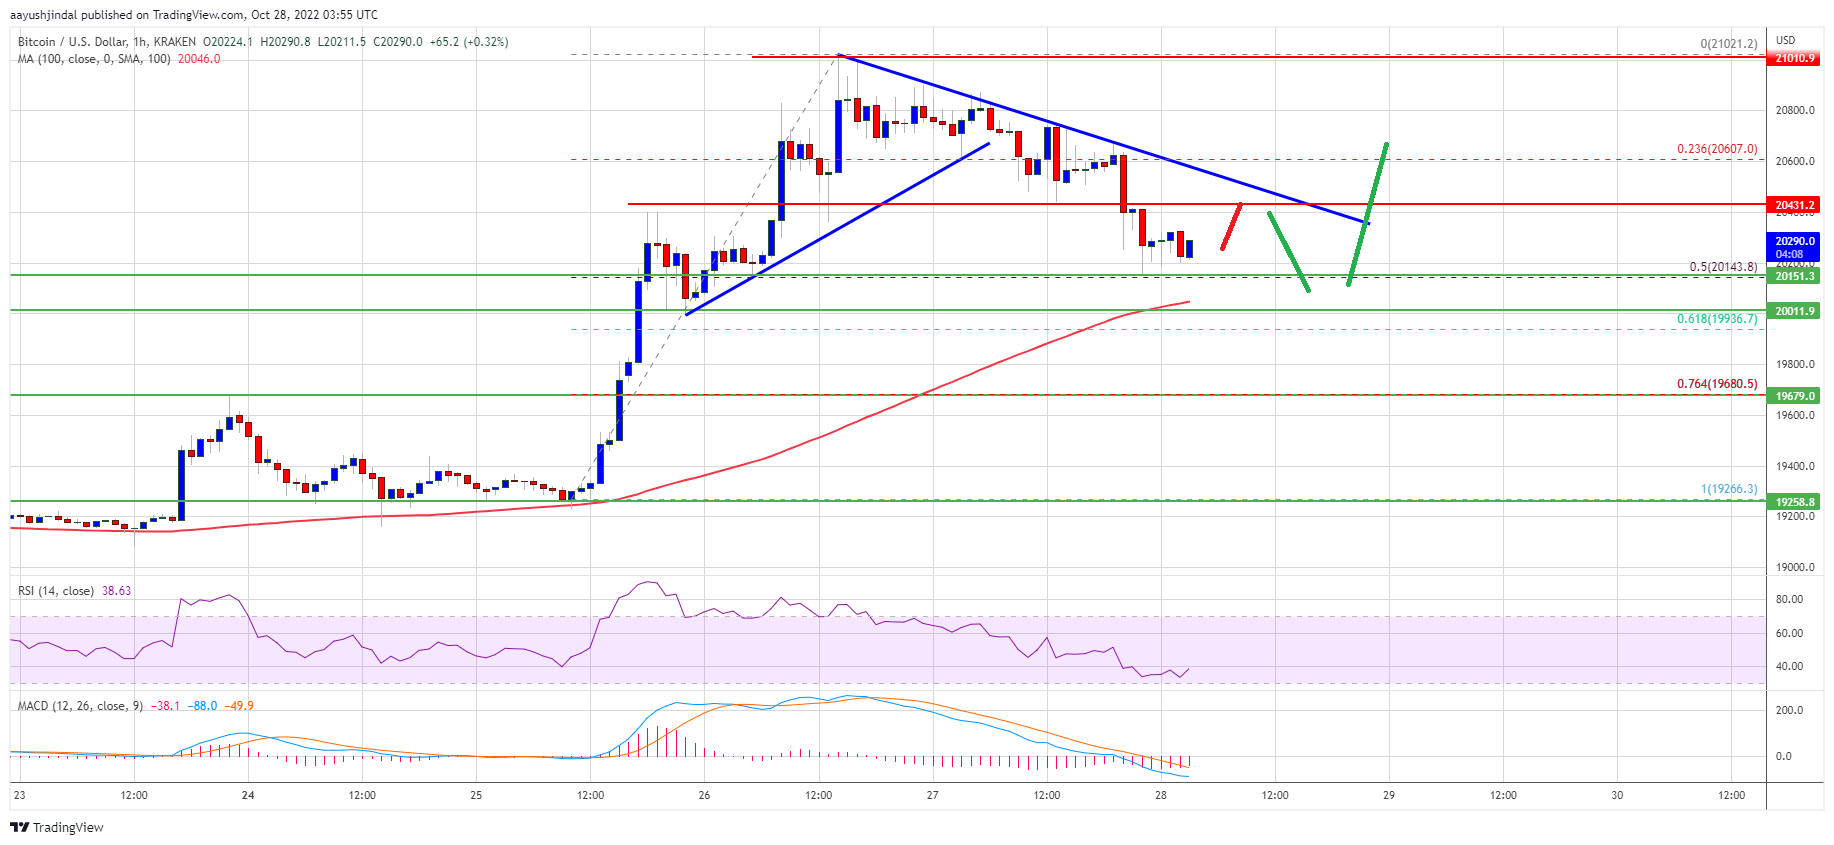
A high was formed near $21,021 before there was a downside correction. The price declined below the $20,800 and $20,500 levels. It even broke the 23.6% Fib retracement level of the key increase from the $19,266 swing low to $21,021 high.
Bitcoin price is now trading above $20,000 and the 100 hourly simple moving average. It seems to be holding gains above the $20,000 and $20,200 levels.
The price also tested the 50% Fib retracement level of the key increase from the $19,266 swing low to $21,021 high. On the upside, an immediate resistance is near the $20,400 zone. There is also a key bearish trend line forming with resistance near $20,440 on the hourly chart of the BTC/USD pair.
Source: BTCUSD on TradingView.com
The first major resistance sits near the $20,500 level and the trend line. The next major resistance might be $21,000. A clear move above the $21,000 resistance might send the price towards the $22,000 resistance. Any more gains open the doors for a test of the $22,500 resistance zone.
If bitcoin fails to rise above the $20,500 resistance zone, it could continue to move down. An immediate support on the downside is near the $20,150 zone.
The next major support is near the $20,000 zone and the 100 hourly simple moving average. A downside break and close below $20,000 might open the doors for a move towards the $19,500 support zone.
Technical indicators:
Hourly MACD – The MACD is now gaining pace in the bearish zone.
Hourly RSI (Relative Strength Index) – The RSI for BTC/USD is now below the 50 level.
Major Support Levels – $20,200, followed by $20,000.
Major Resistance Levels – $20,400, $20,500 and $21,000.
Bitcoin price started a downside correction from $21,000 against the US Dollar. BTC is stable above $20,000 and might start a fresh increase.
Bitcoin is holding gains above the $20,000 and $20,200 levels.
The price is trading above $20,000 and the 100 hourly simple moving average.
There is a key bearish trend line forming with resistance near $20,440 on the hourly chart of the BTC/USD pair (data feed from Kraken).
The pair could start another upward move if there is a clear move above the $20,500 resistance.
Bitcoin price started a fresh increase above the $20,000 and $20,500 resistance levels. BTC even traded above the $20,800 level and tested the $21,000 resistance zone.
A high was formed near $21,021 before there was a downside correction. The price declined below the $20,800 and $20,500 levels. It even broke the 23.6% Fib retracement level of the key increase from the $19,266 swing low to $21,021 high.
Bitcoin price is now trading above $20,000 and the 100 hourly simple moving average. It seems to be holding gains above the $20,000 and $20,200 levels.
The price also tested the 50% Fib retracement level of the key increase from the $19,266 swing low to $21,021 high. On the upside, an immediate resistance is near the $20,400 zone. There is also a key bearish trend line forming with resistance near $20,440 on the hourly chart of the BTC/USD pair.
Source: BTCUSD on TradingView.com
The first major resistance sits near the $20,500 level and the trend line. The next major resistance might be $21,000. A clear move above the $21,000 resistance might send the price towards the $22,000 resistance. Any more gains open the doors for a test of the $22,500 resistance zone.
If bitcoin fails to rise above the $20,500 resistance zone, it could continue to move down. An immediate support on the downside is near the $20,150 zone.
The next major support is near the $20,000 zone and the 100 hourly simple moving average. A downside break and close below $20,000 might open the doors for a move towards the $19,500 support zone.
Technical indicators:
Hourly MACD – The MACD is now gaining pace in the bearish zone.
Hourly RSI (Relative Strength Index) – The RSI for BTC/USD is now below the 50 level.
Major Support Levels – $20,200, followed by $20,000.
Major Resistance Levels – $20,400, $20,500 and $21,000.
Tags: bitcoinbtcusdBTCUSDTxbtusd
NewsBTCRead More
Bitcoin Magazine David Bailey Confirmed As A Bitcoin 2026 Speaker David Bailey has been officially…
Bitcoin Magazine Paraguay Adopts Stricter Crypto Oversight, Mandates Detailed Transaction on Bitcoin Reporting Paraguay’s National…
Bitcoin Magazine Policy Group Calls for Bitcoin Inclusion in Proposed Crypto Tax Exemption The Bitcoin…
Bitcoin Magazine Corporate Bitcoin Holdings Hit Record High as Institutions Accumulate 2.8x Mining Supply: Report…
Research shows that only 8% to 10% of global Bitcoin hashrate runs in oil-sensitive power…
Today’s quantum computers are far from breaking Bitcoin’s cryptography and any real threat would likely…