Bitcoin price started a downside correction below $23,000. BTC is testing an important support and might start a fresh increase towards $23,500.
Bitcoin started a downside correction and declined below the $23,000 support zone.
The price is trading below $23,000 and the 100 hourly simple moving average.
There is a major bullish trend line forming with support near $22,400 on the hourly chart of the BTC/USD pair (data feed from Kraken).
The pair could start a fresh increase if it stays above the $22,000 support zone.
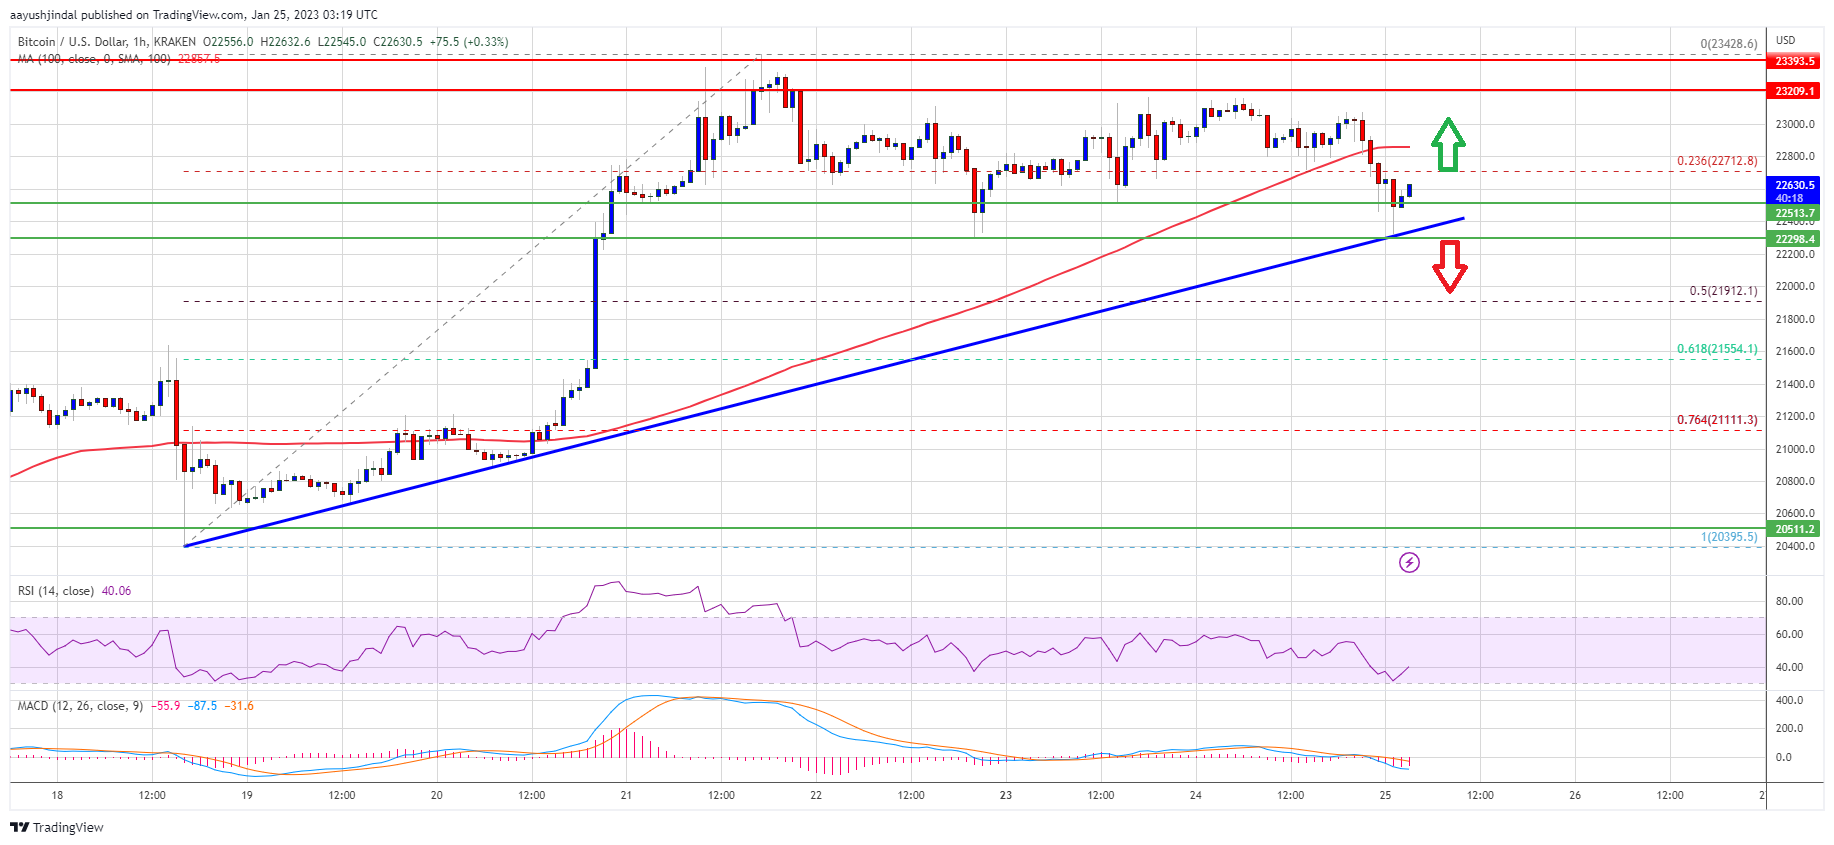
Bitcoin price struggled to clear the $23,400 and $23,500 resistance levels. BTC started a downside correction and traded below the $23,000 support zone.
The price declined below the 23.6% Fib retracement level of the key increase from the $20,395 swing low to $24,250 high. The price even spiked below the $22,500 support level. However, the bulls appeared near the $22,200 support zone.
There is also a major bullish trend line forming with support near $22,400 on the hourly chart of the BTC/USD pair. Bitcoin price is now trading below $23,000 and the 100 hourly simple moving average.
An immediate resistance is near the $22,700 level. The next major resistance is near the $22,850 zone or the 100 hourly simple moving average, above which the price might gain bullish momentum. In the stated case, the price may perhaps rise towards the $23,200 level.
Source: BTCUSD on TradingView.com
The next resistance could be near the $23,500 level. Any more gains might send btc price towards the $24,200 level.
If bitcoin price stays above the trend line support or $22,200, it could continue to move down. An immediate support on the downside is near the $22,000 zone.
The next major support is near the $21,900 zone or the 50% Fib retracement level of the key increase from the $20,395 swing low to $24,250 high. A downside break below the $21,900 level might send the price towards the $21,200 level. Any more losses might send the price to $20,500 in the near term.
Technical indicators:
Hourly MACD – The MACD is now losing pace in the bullish zone.
Hourly RSI (Relative Strength Index) – The RSI for BTC/USD is now below the 50 level.
Major Support Levels – $22,100, followed by $22,000.
Major Resistance Levels – $22,700, $22,850 and $23,200.
Bitcoin price started a downside correction below $23,000. BTC is testing an important support and might start a fresh increase towards $23,500.
Bitcoin started a downside correction and declined below the $23,000 support zone.
The price is trading below $23,000 and the 100 hourly simple moving average.
There is a major bullish trend line forming with support near $22,400 on the hourly chart of the BTC/USD pair (data feed from Kraken).
The pair could start a fresh increase if it stays above the $22,000 support zone.
Bitcoin price struggled to clear the $23,400 and $23,500 resistance levels. BTC started a downside correction and traded below the $23,000 support zone.
The price declined below the 23.6% Fib retracement level of the key increase from the $20,395 swing low to $24,250 high. The price even spiked below the $22,500 support level. However, the bulls appeared near the $22,200 support zone.
There is also a major bullish trend line forming with support near $22,400 on the hourly chart of the BTC/USD pair. Bitcoin price is now trading below $23,000 and the 100 hourly simple moving average.
An immediate resistance is near the $22,700 level. The next major resistance is near the $22,850 zone or the 100 hourly simple moving average, above which the price might gain bullish momentum. In the stated case, the price may perhaps rise towards the $23,200 level.
Source: BTCUSD on TradingView.com
The next resistance could be near the $23,500 level. Any more gains might send btc price towards the $24,200 level.
If bitcoin price stays above the trend line support or $22,200, it could continue to move down. An immediate support on the downside is near the $22,000 zone.
The next major support is near the $21,900 zone or the 50% Fib retracement level of the key increase from the $20,395 swing low to $24,250 high. A downside break below the $21,900 level might send the price towards the $21,200 level. Any more losses might send the price to $20,500 in the near term.
Technical indicators:
Hourly MACD – The MACD is now losing pace in the bullish zone.
Hourly RSI (Relative Strength Index) – The RSI for BTC/USD is now below the 50 level.
Major Support Levels – $22,100, followed by $22,000.
Major Resistance Levels – $22,700, $22,850 and $23,200.
Tags: bitcoinbitcoin pricebtcusdBTCUSDTxbtusd
NewsBTCRead More
Bitcoin Magazine Metaplanet Adds 2,823 Bitcoin, Reaches 43,000 BTC and Becomes World’s Third-Largest Corporate Treasury…
Bitcoin and major cryptocurrencies rebounded on dovish Federal Reserve signals, with speculative tokens like Memecore’s…
Your day-ahead look for July 2, 2026Read MoreCoinDesk: Bitcoin, Ethereum, Crypto News and Price Data[#item_full_content]
Bitcoin rose more than 4% to trade above $61,000, its strongest level in over a…
The Japanese firm, now the world's third largest publicly traded bitcoin holder, reported stronger Bitcoin…
Post ContentRead MoreCoinDesk: Bitcoin, Ethereum, Crypto News and Price Data[#item_full_content]