Bitcoin price corrected lower from $19,650 against the US Dollar. BTC is holding the $19,200 support and might soon start a fresh increase.
Bitcoin started a downside correction after it failed to clear the $19,650 zone.
The price is trading above $19,200 and the 100 hourly simple moving average.
There is a connecting bearish trend line forming with resistance near $19,320 on the hourly chart of the BTC/USD pair (data feed from Kraken).
The pair could start a fresh increase if there is a clear move above the $19,350 resistance.
Bitcoin price was able to gain pace for a move above the $19,500 resistance. However, BTC struggled above the $19,600 zone. It traded as high as $19,679 and recently started a downside correction.
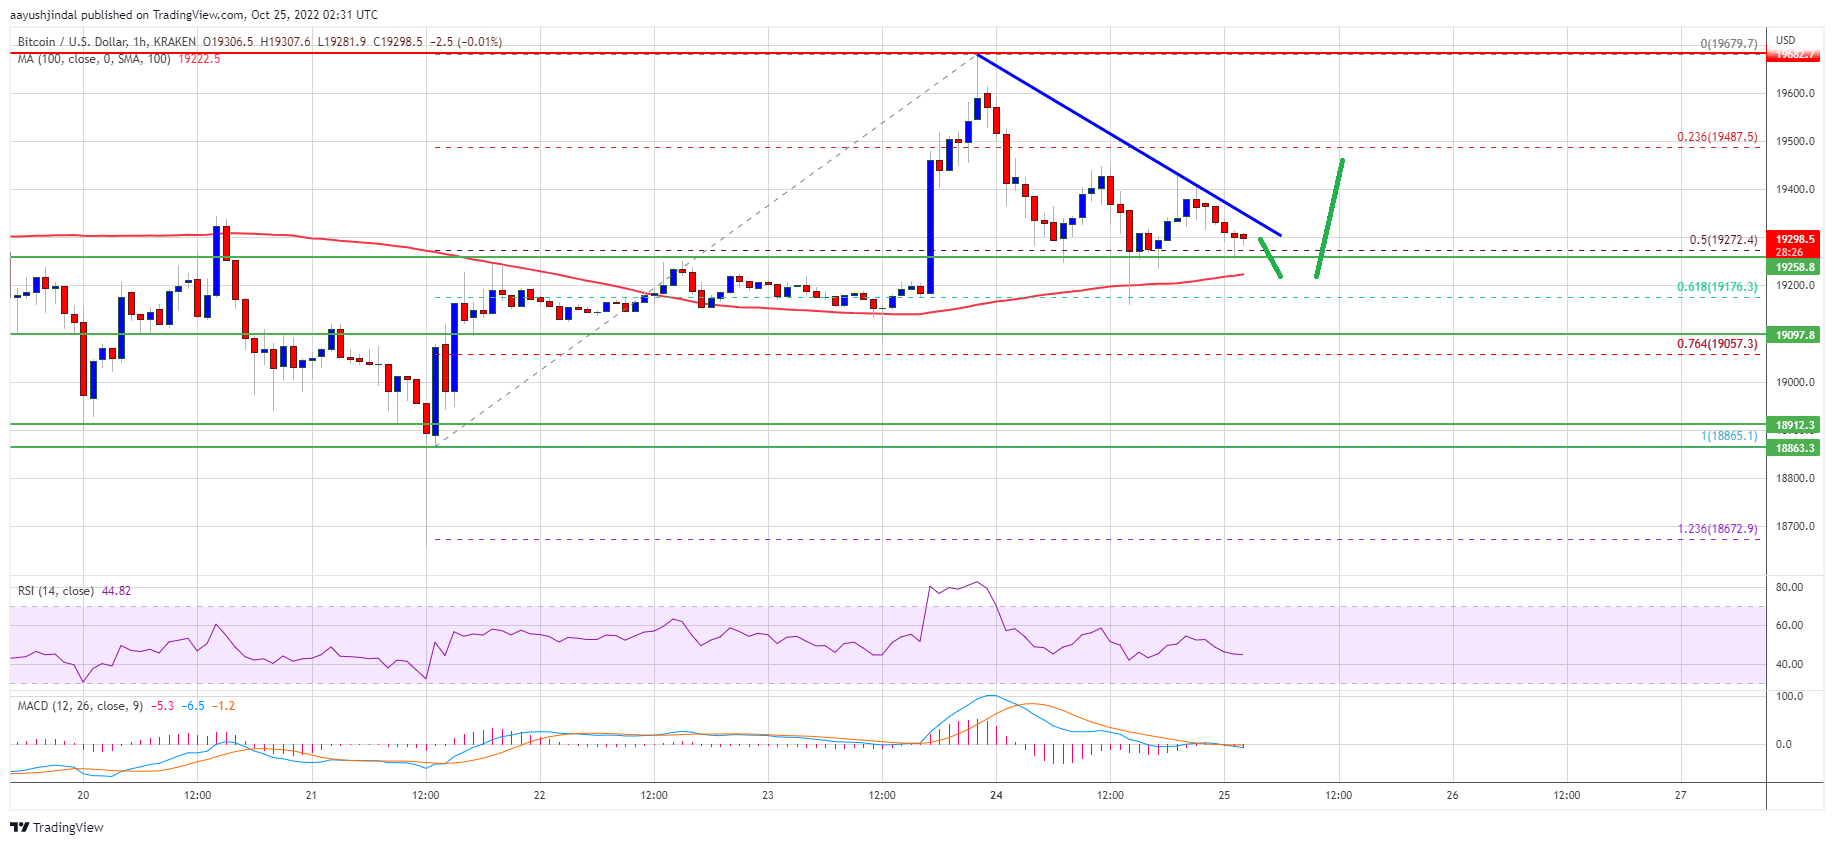
There was a correction below the $19,500 and $19,400 levels. The price declined below the 23.6% Fib retracement level of the key increase from the $18,865 swing low to $19,680 high. The price even spiked below the $19,250 level.
However, the bulls were active near the $19,200 support zone. Bitcoin price is now trading above $19,200 and the 100 hourly simple moving average. It is also stable above the 50% Fib retracement level of the key increase from the $18,865 swing low to $19,680 high.
On the upside, an immediate resistance is near the $19,320 level. There is also a connecting bearish trend line forming with resistance near $19,320 on the hourly chart of the BTC/USD pair.
Source: BTCUSD on TradingView.com
The first major resistance sits near the $19,500 level. The next major resistance might be $19,650. A clear move above the $19,650 resistance might send the price towards the $20,000 resistance. Any more gains might set the pace for a steady increase towards the $21,200 resistance zone.
If bitcoin fails to rise above the $19,500 resistance zone, it could continue to move down. An immediate support on the downside is near the $19,270 zone.
The next major support is near the $19,200 zone and the 100 hourly simple moving average. A downside break and close below $19,200 might open the doors for a fresh test of the $18,800 support.
Technical indicators:
Hourly MACD – The MACD is now losing pace in the bullish zone.
Hourly RSI (Relative Strength Index) – The RSI for BTC/USD is now below the 50 level.
Major Support Levels – $19,270, followed by $19,200.
Major Resistance Levels – $19,320, $19,500 and $19,650.
Bitcoin price corrected lower from $19,650 against the US Dollar. BTC is holding the $19,200 support and might soon start a fresh increase.
Bitcoin started a downside correction after it failed to clear the $19,650 zone.
The price is trading above $19,200 and the 100 hourly simple moving average.
There is a connecting bearish trend line forming with resistance near $19,320 on the hourly chart of the BTC/USD pair (data feed from Kraken).
The pair could start a fresh increase if there is a clear move above the $19,350 resistance.
Bitcoin price was able to gain pace for a move above the $19,500 resistance. However, BTC struggled above the $19,600 zone. It traded as high as $19,679 and recently started a downside correction.
There was a correction below the $19,500 and $19,400 levels. The price declined below the 23.6% Fib retracement level of the key increase from the $18,865 swing low to $19,680 high. The price even spiked below the $19,250 level.
However, the bulls were active near the $19,200 support zone. Bitcoin price is now trading above $19,200 and the 100 hourly simple moving average. It is also stable above the 50% Fib retracement level of the key increase from the $18,865 swing low to $19,680 high.
On the upside, an immediate resistance is near the $19,320 level. There is also a connecting bearish trend line forming with resistance near $19,320 on the hourly chart of the BTC/USD pair.
Source: BTCUSD on TradingView.com
The first major resistance sits near the $19,500 level. The next major resistance might be $19,650. A clear move above the $19,650 resistance might send the price towards the $20,000 resistance. Any more gains might set the pace for a steady increase towards the $21,200 resistance zone.
If bitcoin fails to rise above the $19,500 resistance zone, it could continue to move down. An immediate support on the downside is near the $19,270 zone.
The next major support is near the $19,200 zone and the 100 hourly simple moving average. A downside break and close below $19,200 might open the doors for a fresh test of the $18,800 support.
Technical indicators:
Hourly MACD – The MACD is now losing pace in the bullish zone.
Hourly RSI (Relative Strength Index) – The RSI for BTC/USD is now below the 50 level.
Major Support Levels – $19,270, followed by $19,200.
Major Resistance Levels – $19,320, $19,500 and $19,650.
Tags: bitcoinbtcusdBTCUSDTxbtusd
NewsBTCRead More
A surge in Rune protocol activity is pushing Bitcoin transaction counts and fee generation to…
CryptoQuant says the cash cushion behind Strategy's STRC has thinned from seven years of coverage…
Bitcoin "OGs" have slashed their selling activity to the lowest levels in nearly two years.Read…
Trading firm Wintermute's options desk puts bitcoin in a $61,242 to $63,563 range for Tuesday,…
A renewed rout in semiconductor stocks pulled risk assets lower again, and crypto kept sliding.…
TL;DR South Korea’s KOSPI suffered a near-10% drop after regulators warned over leveraged ETF risk…