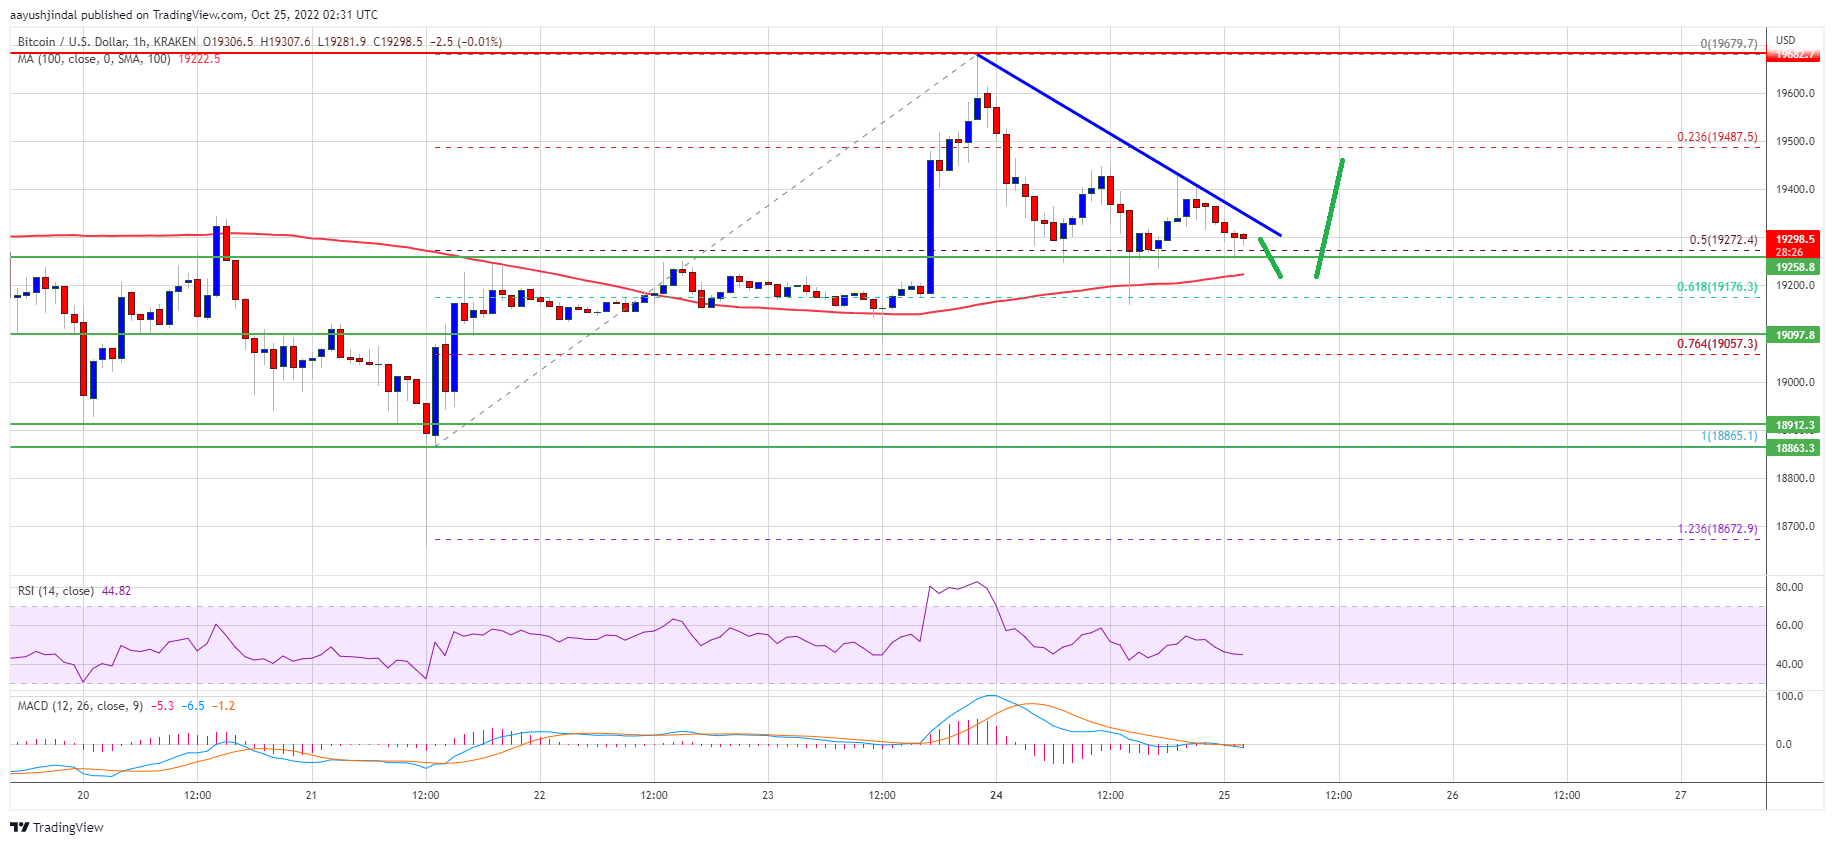
Bitcoin price corrected lower from $19,650 against the US Dollar. BTC is holding the $19,200 support and might soon start a fresh increase.
Bitcoin started a downside correction after it failed to clear the $19,650 zone.
The price is trading above $19,200 and the 100 hourly simple moving average.
There is a connecting bearish trend line forming with resistance near $19,320 on the hourly chart of the BTC/USD pair (data feed from Kraken).
The pair could start a fresh increase if there is a clear move above the $19,350 resistance.
Bitcoin price was able to gain pace for a move above the $19,500 resistance. However, BTC struggled above the $19,600 zone. It traded as high as $19,679 and recently started a downside correction.
There was a correction below the $19,500 and $19,400 levels. The price declined below the 23.6% Fib retracement level of the key increase from the $18,865 swing low to $19,680 high. The price even spiked below the $19,250 level.
However, the bulls were active near the $19,200 support zone. Bitcoin price is now trading above $19,200 and the 100 hourly simple moving average. It is also stable above the 50% Fib retracement level of the key increase from the $18,865 swing low to $19,680 high.
On the upside, an immediate resistance is near the $19,320 level. There is also a connecting bearish trend line forming with resistance near $19,320 on the hourly chart of the BTC/USD pair.
Source: BTCUSD on TradingView.com
The first major resistance sits near the $19,500 level. The next major resistance might be $19,650. A clear move above the $19,650 resistance might send the price towards the $20,000 resistance. Any more gains might set the pace for a steady increase towards the $21,200 resistance zone.
If bitcoin fails to rise above the $19,500 resistance zone, it could continue to move down. An immediate support on the downside is near the $19,270 zone.
The next major support is near the $19,200 zone and the 100 hourly simple moving average. A downside break and close below $19,200 might open the doors for a fresh test of the $18,800 support.
Technical indicators:
Hourly MACD – The MACD is now losing pace in the bullish zone.
Hourly RSI (Relative Strength Index) – The RSI for BTC/USD is now below the 50 level.
Major Support Levels – $19,270, followed by $19,200.
Major Resistance Levels – $19,320, $19,500 and $19,650.
Tags: bitcoinbtcusdBTCUSDTxbtusd
NewsBTCRead More
BTC holds near $70,000 and outperforms major assets during Middle East tensions, even as derivatives…
Two Prime CEO Alexander Blume says the high yield product driving the buying surge carries…
Your day-ahead look for March 12, 2026Read MoreCoinDesk: Bitcoin, Ethereum, Crypto News and Price Data[#item_full_content]
The futures-to-spot ratio has climbed to 5.1, reflecting a structural shift in how the market…
Bitcoin traded around $69,800 as open interest rose to $102 billion, suggesting defensive, bearish bets…
Bitcoin (BTC) is currently navigating a trading range between $60,000 and $73,000, entering what analytics…