Bitcoin price is correcting gains and trading below $27,500. BTC must stay above the 100 hourly SMA to start a fresh increase in the near term.
Bitcoin struggled to climb above $27,500 and started a downside correction.
The price is trading above $26,600 and the 100 hourly Simple moving average.
There is a key rising channel forming with support near $27,000 on the hourly chart of the BTC/USD pair (data feed from Kraken).
The pair could start a fresh increase if it stays above $26,750 and the 100 hourly SMA.
Bitcoin price climbed higher above the $27,200 resistance zone. However, BTC struggled to clear the $27,500 resistance and started a downside correction.
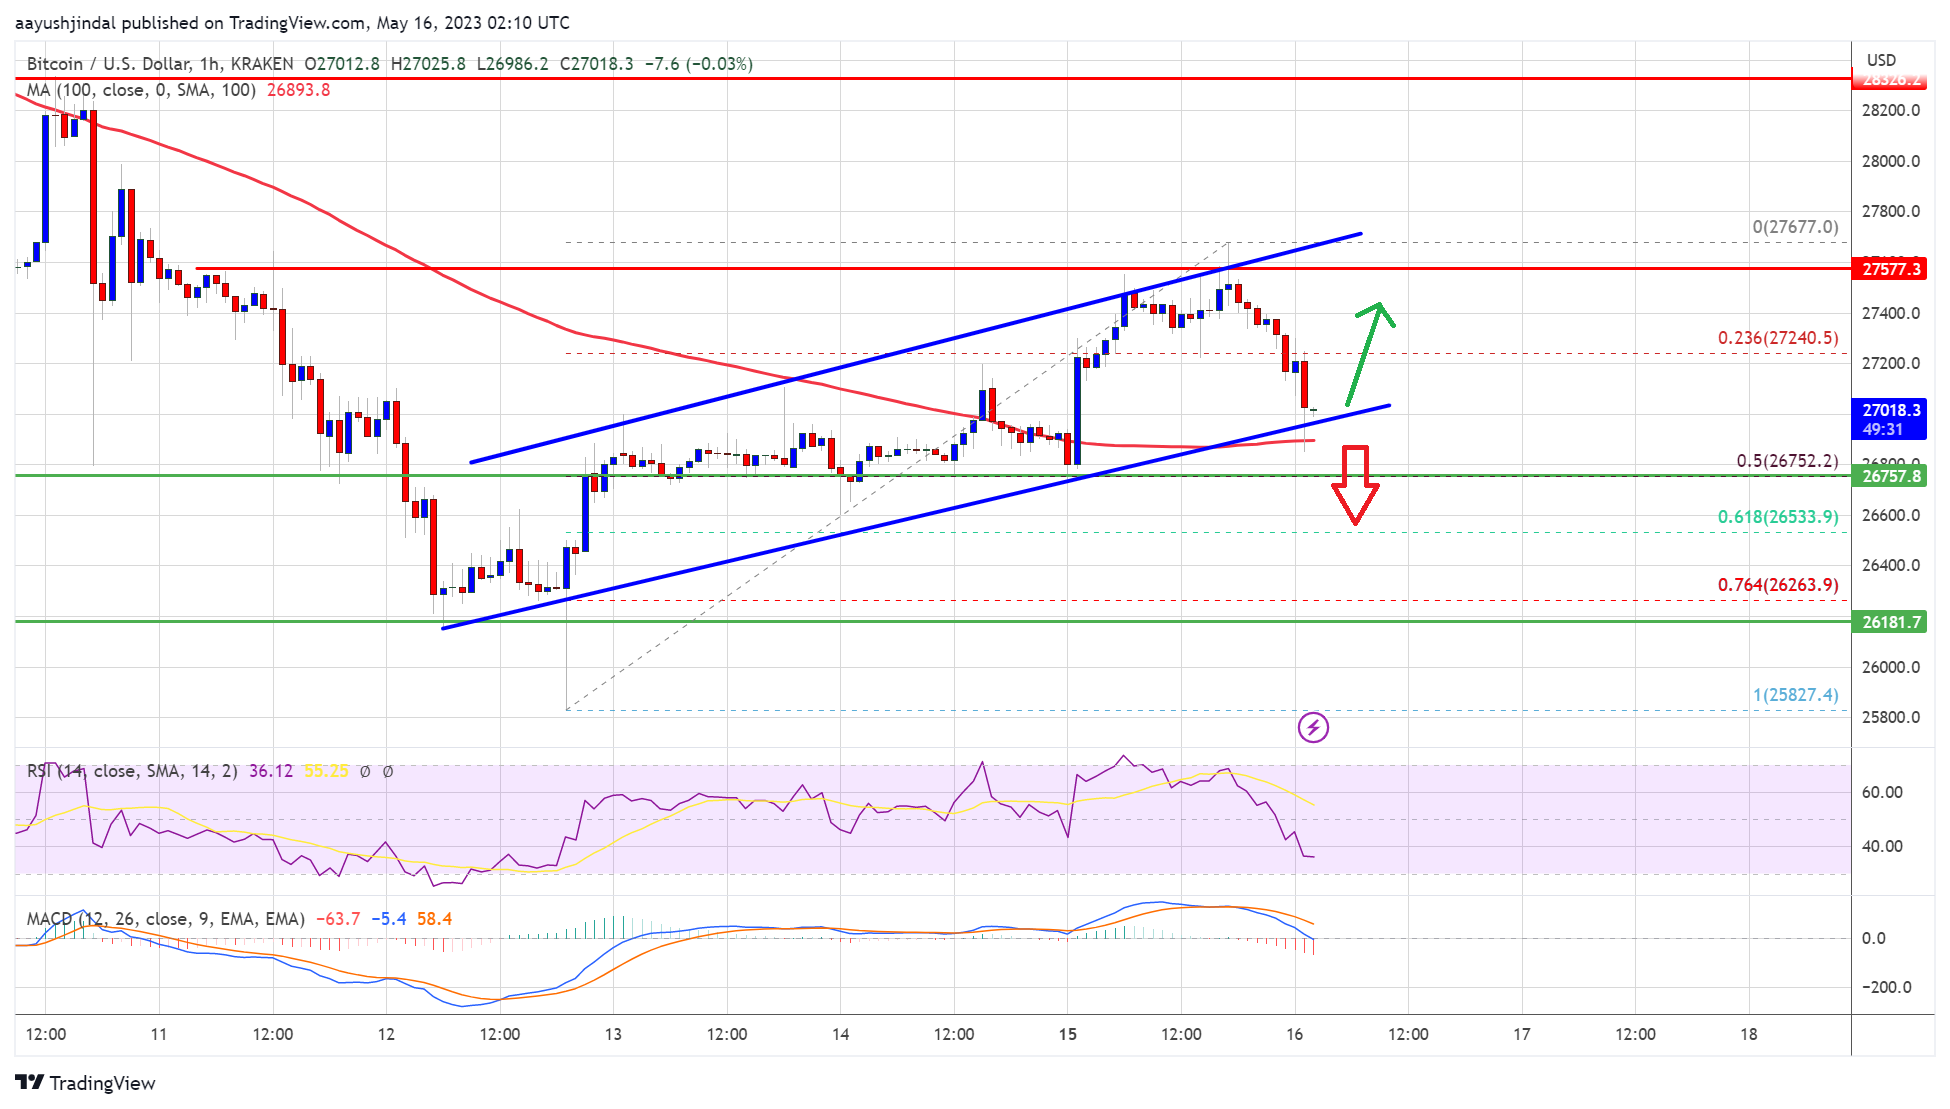
The price declined below the $27,250 level and the 23.6% Fib retracement level of the upward move from the $25,827 swing low to the $27,677 high. The price is now approaching key support near $27,000. There is also a key rising channel forming with support near $27,000 on the hourly chart of the BTC/USD pair.
Bitcoin price is now trading above $26,600 and the 100 hourly Simple moving average. Immediate resistance is now forming near the $27,250 level. The next major resistance is near the $27,500 level.
Source: BTCUSD on TradingView.com
A close above the $27,500 resistance might start a decent increase. The next key resistance is near $28,000, above which the price might climb toward the $28,300 resistance. Any more gains might send the price toward the $28,800 level in the coming sessions.
If Bitcoin’s price fails to remain stable above $27,000, it could continue to move down. Immediate support on the downside is near the $27,000 level and the channel trend line.
The 100 hourly Simple moving average is also below the channel support. The next major support is near the $26,750 zone, below which the price might start a steady decline. In the stated case, it could revisit the $26,200 level. Any more losses might take Bitcoin toward the $26,000 level in the near term. The next major support could be $25,800.
Technical indicators:
Hourly MACD – The MACD is now gaining pace in the bearish zone.
Hourly RSI (Relative Strength Index) – The RSI for BTC/USD is now below the 50 level.
Major Support Levels – $27,000, followed by $26,750.
Major Resistance Levels – $27,250, $27,500, and $28,300.
[#item_full_content]NewsBTCRead MorePost ContentRead MoreCoinDesk: Bitcoin, Ethereum, Crypto News and Price Data[#item_full_content]
Spot ETFs had their strongest inflow day in two months, driven by funds other than…
Bearish traders lost $281 million in liquidations over 24 hours, nearly double the longs, as…
For readers tracking where the market is actually changing, this is the part that matters.…
The headline number is useful, but the real story is what it says about positioning.…
Bitcoin Magazine Bitcoin Exchange Inflows Spike to 49,000 BTC in a Day, Signaling More Volatility…