Bitcoin price traded to a new weekly low before reversing losses against the US Dollar. BTC broke $19,500 and might rise further towards $20,500.
Bitcoin is up nearly 5% and there was a clear move above the $19,500 resistance zone.
The price is trading below above $19,500 and the 100 hourly simple moving average.
There was a break above a major bearish trend line with resistance near $19,150 on the hourly chart of the BTC/USD pair (data feed from Kraken).
The pair is showing bullish signs and might extend gains above $20,000.
Bitcoin Price Starts Fresh Rally
Bitcoin price extended losses below the $19,000 support zone. Yesterday, the US CPI data was released, which posted an increase of 8.2%. It pushed BTC price below the $18,500 support zone.
The bears gained strength and the price dived to the $18,200 support zone. However, the bears failed to push the price further lower. A low was formed near $18,142 and there was a strong bullish reaction. The price gained bullish momentum and climbed above the $19,000 level.
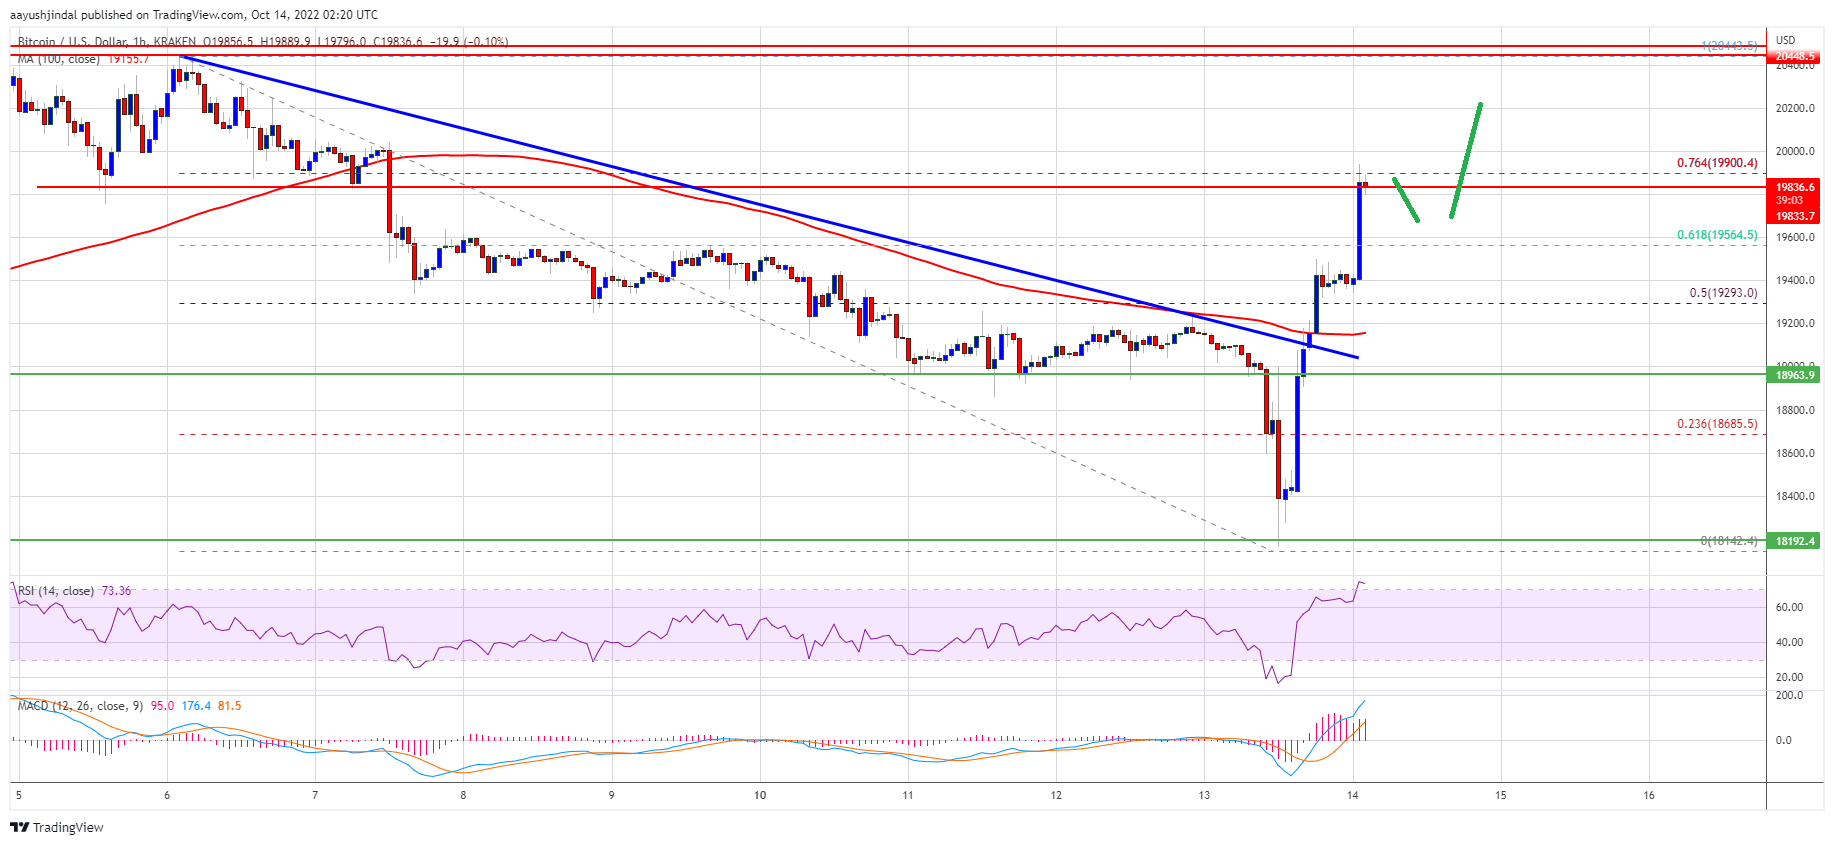
Bitcoin price cleared the 50% Fib retracement level of the downward move from the $20,443 swing high to $18,142 low. Besides, there was a break above a major bearish trend line with resistance near $19,150 on the hourly chart of the BTC/USD pair.
The price is now trading below above $19,500 and the 100 hourly simple moving average. It is trading near the 76.4% Fib retracement level of the downward move from the $20,443 swing high to $18,142 low.
Source: BTCUSD on TradingView.com
On the upside, an immediate resistance is near the $20,000 level. A clear move above the $20,000 resistance might pump the price further higher. The next major resistance is near the $20,450 level. Any more gains might start a steady increase towards the $21,200 resistance zone.
Dips Supported in BTC?
If bitcoin fails to rise above the $20,000 resistance zone, it could start a downside correction. An immediate support on the downside is near the $19,500 zone.
The next major support is near the $19,200 zone and the 100 hourly SMA. A downside break below the $19,200 support zone might increase selling pressure. In the stated case, the price could decline towards the $18,500 support zone.
Technical indicators:
Hourly MACD – The MACD is now gaining pace in the bullish zone.
Hourly RSI (Relative Strength Index) – The RSI for BTC/USD is now in the overbought zone.
Major Support Levels – $19,500, followed by $19,200.
Major Resistance Levels – $20,000, $20,450 and $21,200.
Bitcoin price traded to a new weekly low before reversing losses against the US Dollar. BTC broke $19,500 and might rise further towards $20,500.
Bitcoin is up nearly 5% and there was a clear move above the $19,500 resistance zone.
The price is trading below above $19,500 and the 100 hourly simple moving average.
There was a break above a major bearish trend line with resistance near $19,150 on the hourly chart of the BTC/USD pair (data feed from Kraken).
The pair is showing bullish signs and might extend gains above $20,000.
Bitcoin price extended losses below the $19,000 support zone. Yesterday, the US CPI data was released, which posted an increase of 8.2%. It pushed BTC price below the $18,500 support zone.
The bears gained strength and the price dived to the $18,200 support zone. However, the bears failed to push the price further lower. A low was formed near $18,142 and there was a strong bullish reaction. The price gained bullish momentum and climbed above the $19,000 level.
Bitcoin price cleared the 50% Fib retracement level of the downward move from the $20,443 swing high to $18,142 low. Besides, there was a break above a major bearish trend line with resistance near $19,150 on the hourly chart of the BTC/USD pair.
The price is now trading below above $19,500 and the 100 hourly simple moving average. It is trading near the 76.4% Fib retracement level of the downward move from the $20,443 swing high to $18,142 low.
Source: BTCUSD on TradingView.com
On the upside, an immediate resistance is near the $20,000 level. A clear move above the $20,000 resistance might pump the price further higher. The next major resistance is near the $20,450 level. Any more gains might start a steady increase towards the $21,200 resistance zone.
If bitcoin fails to rise above the $20,000 resistance zone, it could start a downside correction. An immediate support on the downside is near the $19,500 zone.
The next major support is near the $19,200 zone and the 100 hourly SMA. A downside break below the $19,200 support zone might increase selling pressure. In the stated case, the price could decline towards the $18,500 support zone.
Technical indicators:
Hourly MACD – The MACD is now gaining pace in the bullish zone.
Hourly RSI (Relative Strength Index) – The RSI for BTC/USD is now in the overbought zone.
Major Support Levels – $19,500, followed by $19,200.
Major Resistance Levels – $20,000, $20,450 and $21,200.
Tags: bitcoinbtcusdBTCUSDTxbtusd
NewsBTCRead More
Bitcoin rebounded to $66,500 after weekend strikes on Iran triggered $300 million in liquidations. Oil…
Crypto analyst Pure has indicated that the blood moon could be having an impact on…
Iran has reportedly stepped up attacks against U.S. assets in the middle east.Read MoreCoinDesk: Bitcoin,…
Record outflows indicate that institutional appetite for digital assets has collapsed.Read MoreCoinDesk: Bitcoin, Ethereum, Crypto…
Bitcoin saw its price crash toward $60,000 last week, and naturally, investor sentiment took a…
Bitcoin fell back to $66,700 as traditional markets opened to their first chance to price…