Bitcoin price started a strong recovery wave from the $60,800 zone. BTC is up nearly 10% and now facing hurdles near the $68,800 resistance.
Bitcoin price started a decent increase from the $60,800 support zone.
The price is trading above $64,500 and the 100 hourly Simple moving average.
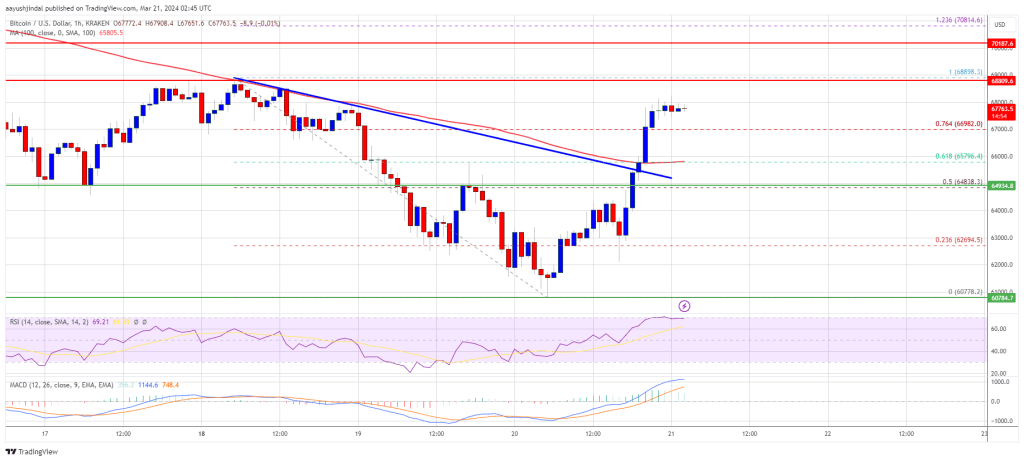
There was a break above a key bearish trend line with resistance at $65,000 on the hourly chart of the BTC/USD pair (data feed from Kraken).
The pair must clear the $68,800 resistance zone to start a fresh uptrend.
Bitcoin price extended its decline below the $62,500 zone. BTC even spiked below the $61,200 level before the bulls appeared near $60,800. A low was formed near $60,778 and the price is now moving higher.
There was a decent increase above the $63,000 and $64,000 resistance levels. The price even cleared the 50% Fib retracement level of the downward move from the $68,898 swing high to the $60,778 low. There was a break above a key bearish trend line with resistance at $65,000 on the hourly chart of the BTC/USD pair.
Bitcoin is now trading above $64,500 and the 100 hourly Simple moving average. It is also above the 76.4% Fib retracement level of the downward move from the $68,898 swing high to the $60,778 low.
Source: BTCUSD on TradingView.com
Immediate resistance is near the $68,000 level. The first major resistance could be $68,800. If there is a clear move above the $68,800 resistance zone, the price could continue to gain strength. In the stated case, the price could even clear the $70,000 resistance zone in the near term. The next key resistance sits at $72,500.
If Bitcoin fails to rise above the $68,800 resistance zone, it could start another decline. Immediate support on the downside is near the $66,800 level.
The first major support is $65,500. The next support sits at $64,800. If there is a close below $64,800, the price could start a drop toward the $63,000 level. Any more losses might send the price toward the $62,500 support zone in the near term.
Technical indicators:
Hourly MACD – The MACD is now gaining pace in the bullish zone.
Hourly RSI (Relative Strength Index) – The RSI for BTC/USD is now above the 60 level.
Major Support Levels – $65,500, followed by $64,800.
Major Resistance Levels – $68,000, $68,800, and $70,000.
[#item_full_content]NewsBTCRead MoreMorgan Stanley’s low-fee bitcoin ETF debuted with strong early trading, signaling demand as competition shifts…
Bitcoin Magazine Adam Back Says Quantum Threat to Bitcoin Is Decades Away, Urges Gradual Migration…
The current consolidation of Bitcoin is showing signs of a deeper shift rather than a…
Blockstream CEO, Adam Back, denied on Wednesday that he is Satoshi Nakamoto, the pseudonymous creator…
Bitcoin Magazine Nunchuk Releases Open-Source Tools for Bitcoin Agents With Bounded Authority Nunchuk has released…
Speaking at a Mizuho event, the Strategy (MSTR) executive chairman said the formation of banking…