Bitcoin price found support near the $60,600 zone. BTC is recovering but the bears might remain active near the $63,200 resistance zone.
Bitcoin tested the $60,60 support zone and started a recovery wave.
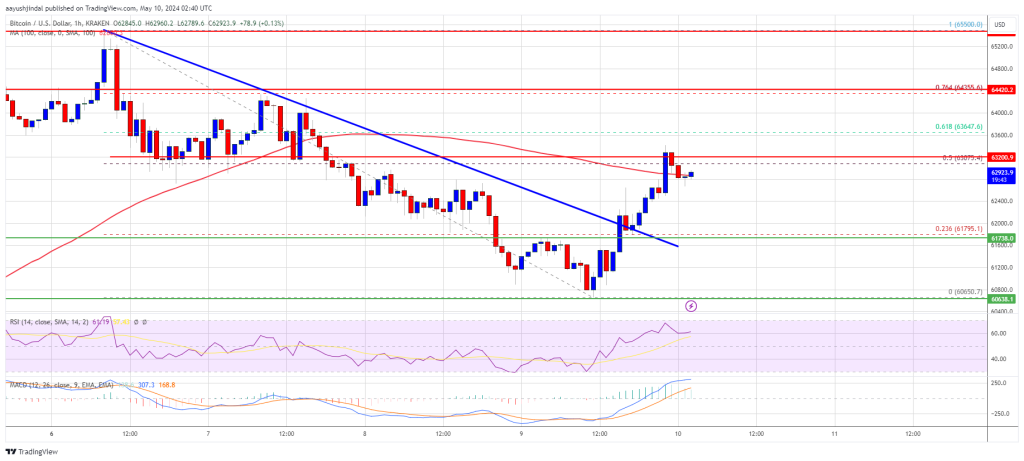
The price is trading near $63,000 and the 100 hourly Simple moving average.
There was a break above a key bearish trend line with resistance at $62,000 on the hourly chart of the BTC/USD pair (data feed from Kraken).
The pair could gain bullish momentum if there is a close above $63,200 and the 100 hourly Simple moving average.
Bitcoin price extended losses below the $62,000 and $61,200 levels. Finally, the bulls appeared near the $60,600 zone. A low was formed at $60,650 and the price is now correcting losses.
There was a move above the $61,200 and $62,000 resistance levels. The price cleared the 23.6% Fib retracement level of the recent drop from the $65,500 swing high to the $60,650 low. Besides, there was a break above a key bearish trend line with resistance at $62,000 on the hourly chart of the BTC/USD pair.
Bitcoin is now trading near $63,000 and the 100 hourly Simple moving average. Immediate resistance is near the $63,000 level. The first major resistance could be $63,200 or the 50% Fib retracement level of the recent drop from the $65,500 swing high to the $60,650 low or the 100 hourly Simple moving average.
Source: BTCUSD on TradingView.com
The next key resistance could be $64,350. A clear move above the $64,350 resistance might send the price higher. The main resistance now sits at $65,500. If there is a close above the $65,500 resistance zone, the price could continue to move up. In the stated case, the price could rise toward $67,500.
If Bitcoin fails to climb above the $63,200 resistance zone, it could start another decline. Immediate support on the downside is near the $62,400 level.
The first major support is $62,000. If there is a close below $62,000, the price could start to drop toward $61,200. Any more losses might send the price toward the $60,600 support zone in the near term.
Technical indicators:
Hourly MACD – The MACD is now gaining pace in the bullish zone.
Hourly RSI (Relative Strength Index) – The RSI for BTC/USD is now above the 50 level.
Major Support Levels – $62,000, followed by $60,600.
Major Resistance Levels – $63,000, $63,200, and $64,350.
[#item_full_content]NewsBTCRead MoreRising real rates and inflation risks weigh on gold, while bitcoin continues to consolidate.Read MoreCoinDesk:…
The price of Bitcoin has continued to hover around the $70,000 level this weekend, establishing…
The Bitcoin market commenced an extended bearish phase in October 2025, after an initial flash…
BTC fell 2.2% as $299 million in liquidations hit crypto markets, with long positions accounting…
The average production cost was sitting at $88,000 per bitcoin in mid-March, according to Checkonchain's…
Traders are watching support near $1.40 as repeated failures below $1.60 reinforce broader downtrend.Read MoreCoinDesk:…