Bitcoin price remained well bid above the $20,000 support zone. BTC is consolidating and might start a fresh rally if it clears the $20,500 resistance zone.
Bitcoin traded in a range above the key $20,000 support zone.
The price is trading below $20,500 and the 100 hourly simple moving average.
There is a crucial bearish trend line forming with resistance near $20,500 on the hourly chart of the BTC/USD pair (data feed from Kraken).
The pair could a fresh rally if it clears the 100 hourly SMA and $20,500.
Bitcoin price started a downside correction below the $20,600 and $20,500 levels. BTC even traded below the $20,250 level and settled below the 100 hourly simple moving average.
However, the bulls were active near the $20,000 zone. A low was formed near $20,059 and the price is now consolidating losses. There was a minor increase above the $20,200 level. The price climbed above the 23.6% Fib retracement level of the downward move from the $20,865 swing high to $20,060 low.
Bitcoin price is now trading below $20,500 and the 100 hourly simple moving average. On the upside, an immediate resistance is near the $20,350 level.
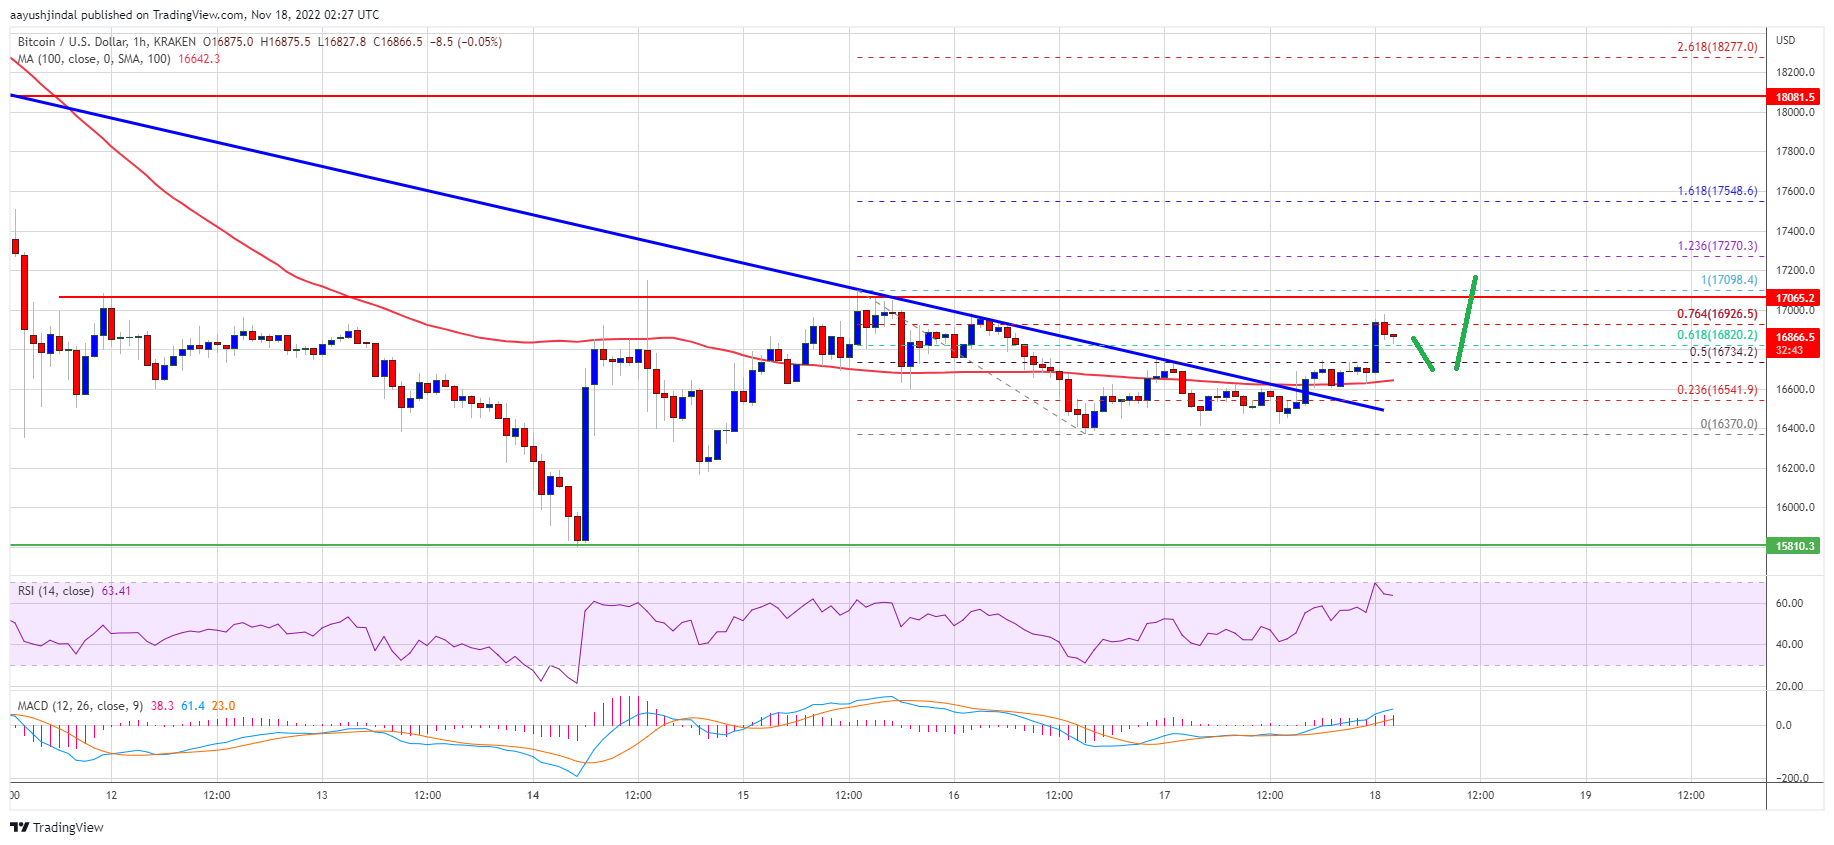
The first major resistance is near the $20,500 level and the 100 hourly simple moving average. There is also a crucial bearish trend line forming with resistance near $20,500 on the hourly chart of the BTC/USD pair. The trend line is near the 50% Fib retracement level of the downward move from the $20,865 swing high to $20,060 low.
Source: BTCUSD on TradingView.com
A clear move above the $20,500 resistance zone could start another steady increase. The next major resistance is near $21,000, above which the price may perhaps rise towards the $22,000 zone.
If bitcoin fails to clear above the $20,500 resistance zone, it could resume its decline. An immediate support on the downside is near the $20,200 zone.
The next major support is near the $20,000 zone or the recent low. A clear move below the $20,000 support might push the price further lower. In this case, the price may perhaps decline towards the $19,200 level.
Technical indicators:
Hourly MACD – The MACD is now gaining pace in the bullish zone.
Hourly RSI (Relative Strength Index) – The RSI for BTC/USD is now above the 50 level.
Major Support Levels – $20,200, followed by $20,000.
Major Resistance Levels – $20,350, $20,500 and $21,000.
Bitcoin price remained well bid above the $20,000 support zone. BTC is consolidating and might start a fresh rally if it clears the $20,500 resistance zone.
Bitcoin traded in a range above the key $20,000 support zone.
The price is trading below $20,500 and the 100 hourly simple moving average.
There is a crucial bearish trend line forming with resistance near $20,500 on the hourly chart of the BTC/USD pair (data feed from Kraken).
The pair could a fresh rally if it clears the 100 hourly SMA and $20,500.
Bitcoin price started a downside correction below the $20,600 and $20,500 levels. BTC even traded below the $20,250 level and settled below the 100 hourly simple moving average.
However, the bulls were active near the $20,000 zone. A low was formed near $20,059 and the price is now consolidating losses. There was a minor increase above the $20,200 level. The price climbed above the 23.6% Fib retracement level of the downward move from the $20,865 swing high to $20,060 low.
Bitcoin price is now trading below $20,500 and the 100 hourly simple moving average. On the upside, an immediate resistance is near the $20,350 level.
The first major resistance is near the $20,500 level and the 100 hourly simple moving average. There is also a crucial bearish trend line forming with resistance near $20,500 on the hourly chart of the BTC/USD pair. The trend line is near the 50% Fib retracement level of the downward move from the $20,865 swing high to $20,060 low.
Source: BTCUSD on TradingView.com
A clear move above the $20,500 resistance zone could start another steady increase. The next major resistance is near $21,000, above which the price may perhaps rise towards the $22,000 zone.
If bitcoin fails to clear above the $20,500 resistance zone, it could resume its decline. An immediate support on the downside is near the $20,200 zone.
The next major support is near the $20,000 zone or the recent low. A clear move below the $20,000 support might push the price further lower. In this case, the price may perhaps decline towards the $19,200 level.
Technical indicators:
Hourly MACD – The MACD is now gaining pace in the bullish zone.
Hourly RSI (Relative Strength Index) – The RSI for BTC/USD is now above the 50 level.
Major Support Levels – $20,200, followed by $20,000.
Major Resistance Levels – $20,350, $20,500 and $21,000.
Tags: bitcoinbtcusdBTCUSDTxbtusd
NewsBTCRead More
Michael Saylor compared bitcoin’s 45% drawdown to Apple’s 2013 slump, arguing that enduring deep corrections…
Your day-ahead look for Feb. 24, 2026Read MoreCoinDesk: Bitcoin, Ethereum, Crypto News and Price Data[#item_full_content]
Glassnode data shows a 43% surge in supply clustered in the $60K to $70K range…
Bitcoin flipped a small but notable technical switch this week when the Coinbase premium moved…
Bitcoin dropped to $63,000 as the dollar climbed and equities weakened. A break below $60,000…
After closing the week below a crucial support level, Bitcoin (BTC) has fallen below the…