Bitcoin price is slowly moving higher above $19,500 against the US Dollar. BTC could gain bullish momentum once it clears the $20,000 resistance zone.
Bitcoin remained well bid and started a decent increase above $19,500.
The price is trading above $19,400 and the 100 hourly simple moving average.
There was a break above a key bearish trend line with resistance near $19,240 on the hourly chart of the BTC/USD pair (data feed from Kraken).
The pair could start a strong increase if there is a close above the $20,000 resistance zone.
Bitcoin Price Eyes More Upsides
Bitcoin price formed a base above the $19,000 resistance zone. BTC remained stable and started a slow and steady increase above the $19,200 level.
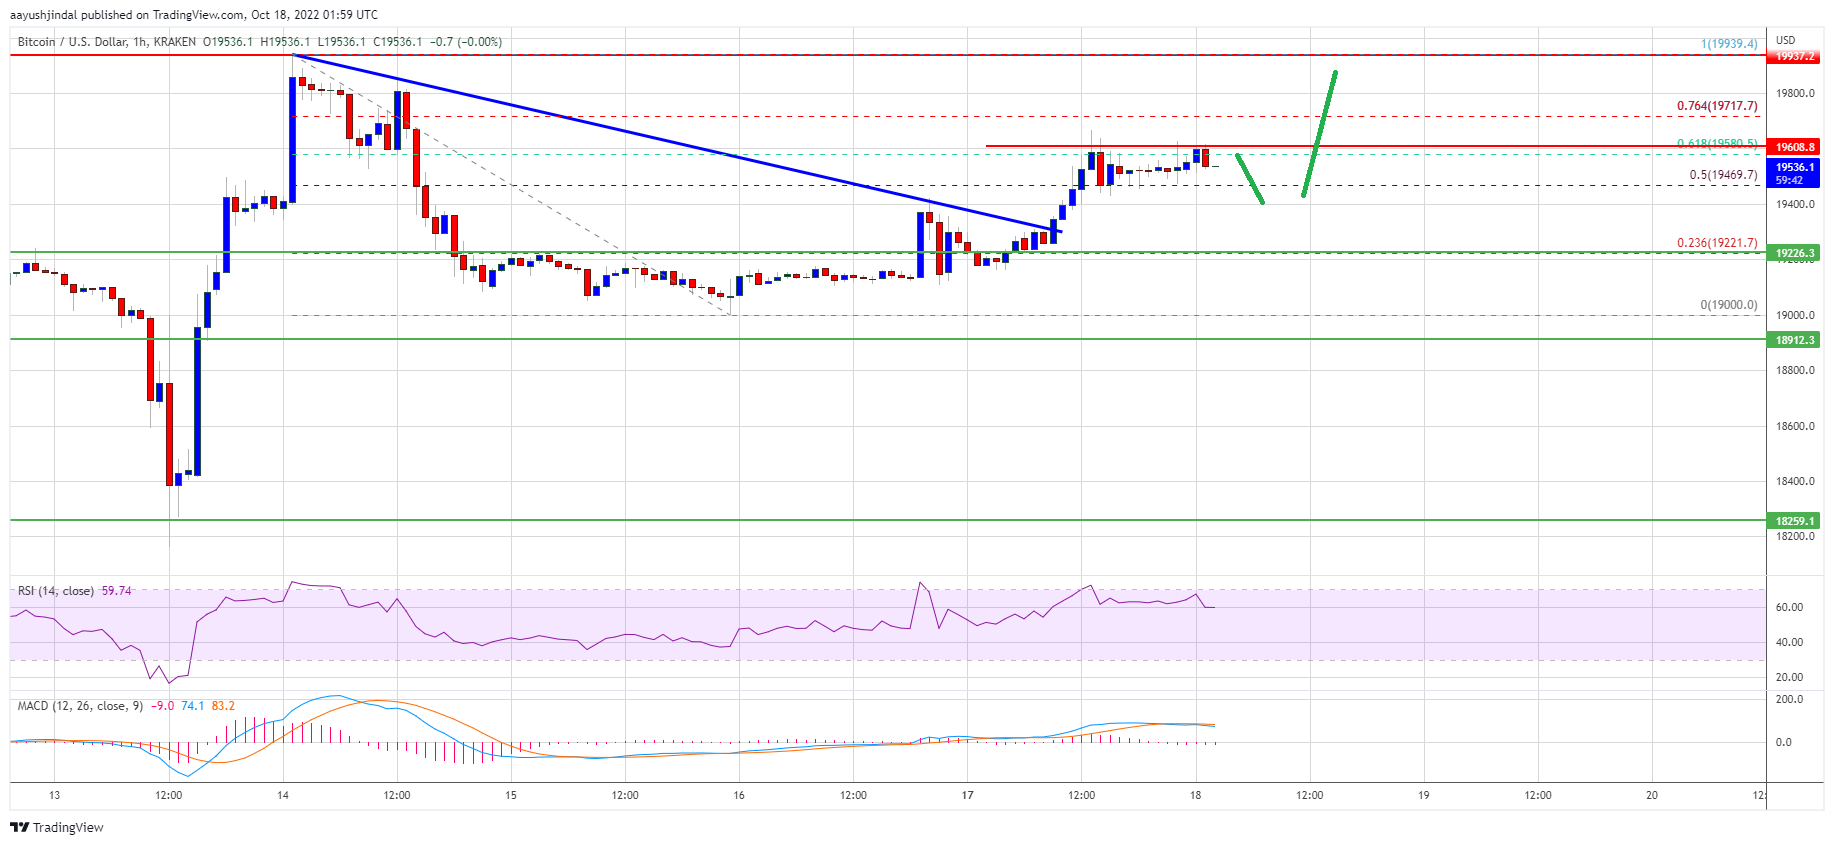
There was a break above a key bearish trend line with resistance near $19,240 on the hourly chart of the BTC/USD pair. The pair was able to clear the 50% Fib retracement level of the downward move from the $19,939 swing high to $19,000 low.
Bitcoin price is now trading above $19,400 and the 100 hourly simple moving average. On the upside, an immediate resistance is near the $19,600 level. It is close to the 61.8% Fib retracement level of the downward move from the $19,939 swing high to $19,000 low.
Source: BTCUSD on TradingView.com
The first major resistance sits near the $20,000 level. A clear move above the $20,000 resistance might pump the price in the near term. In the stated case, the price may perhaps test the $21,200 resistance. Any more gains might start a steady increase towards the $22,000 resistance zone.
Dips Supported in BTC?
If bitcoin fails to rise above the $20,000 resistance zone, it could start a downside correction. An immediate support on the downside is near the $19,200 zone and the 100 hourly simple moving average.
The next major support is near the $19,000 zone. A downside break and close below the $19,000 support zone might increase selling pressure. In the stated case, the price could decline towards the $18,500 support zone. Any more losses might send the price towards the $18,250 level.
Technical indicators:
Hourly MACD – The MACD is now losing pace in the bullish zone.
Hourly RSI (Relative Strength Index) – The RSI for BTC/USD is now above the 50 level.
Major Support Levels – $19,200, followed by $19,000.
Major Resistance Levels – $19,600, $20,000 and $21,200.
Bitcoin price is slowly moving higher above $19,500 against the US Dollar. BTC could gain bullish momentum once it clears the $20,000 resistance zone.
Bitcoin remained well bid and started a decent increase above $19,500.
The price is trading above $19,400 and the 100 hourly simple moving average.
There was a break above a key bearish trend line with resistance near $19,240 on the hourly chart of the BTC/USD pair (data feed from Kraken).
The pair could start a strong increase if there is a close above the $20,000 resistance zone.
Bitcoin price formed a base above the $19,000 resistance zone. BTC remained stable and started a slow and steady increase above the $19,200 level.
There was a break above a key bearish trend line with resistance near $19,240 on the hourly chart of the BTC/USD pair. The pair was able to clear the 50% Fib retracement level of the downward move from the $19,939 swing high to $19,000 low.
Bitcoin price is now trading above $19,400 and the 100 hourly simple moving average. On the upside, an immediate resistance is near the $19,600 level. It is close to the 61.8% Fib retracement level of the downward move from the $19,939 swing high to $19,000 low.
Source: BTCUSD on TradingView.com
The first major resistance sits near the $20,000 level. A clear move above the $20,000 resistance might pump the price in the near term. In the stated case, the price may perhaps test the $21,200 resistance. Any more gains might start a steady increase towards the $22,000 resistance zone.
If bitcoin fails to rise above the $20,000 resistance zone, it could start a downside correction. An immediate support on the downside is near the $19,200 zone and the 100 hourly simple moving average.
The next major support is near the $19,000 zone. A downside break and close below the $19,000 support zone might increase selling pressure. In the stated case, the price could decline towards the $18,500 support zone. Any more losses might send the price towards the $18,250 level.
Technical indicators:
Hourly MACD – The MACD is now losing pace in the bullish zone.
Hourly RSI (Relative Strength Index) – The RSI for BTC/USD is now above the 50 level.
Major Support Levels – $19,200, followed by $19,000.
Major Resistance Levels – $19,600, $20,000 and $21,200.
Tags: bitcoinbtcusdBTCUSDTxbtusd
NewsBTCRead More
Bitcoin Magazine Corporate Bitcoin Holdings Hit Record High as Institutions Accumulate 2.8x Mining Supply: Report…
Research shows that only 8% to 10% of global Bitcoin hashrate runs in oil-sensitive power…
Today’s quantum computers are far from breaking Bitcoin’s cryptography and any real threat would likely…
U.S. President Trump said stopping Iran is more of a concern than oil prices, as…
Crypto analyst Leshka has explained why it is unlikely that the Bitcoin price has bottomed…
Glassnode’s Accumulation Trend Score drops to 0.04 as smaller wallet cohorts offload BTC while macro…