Bitcoin price started a recovery wave above $68,000. BTC is now consolidating gains above $70,000 and faces hurdles near the $72,200 zone.
Bitcoin is attempting to recover but is facing many hurdles near $72,000.
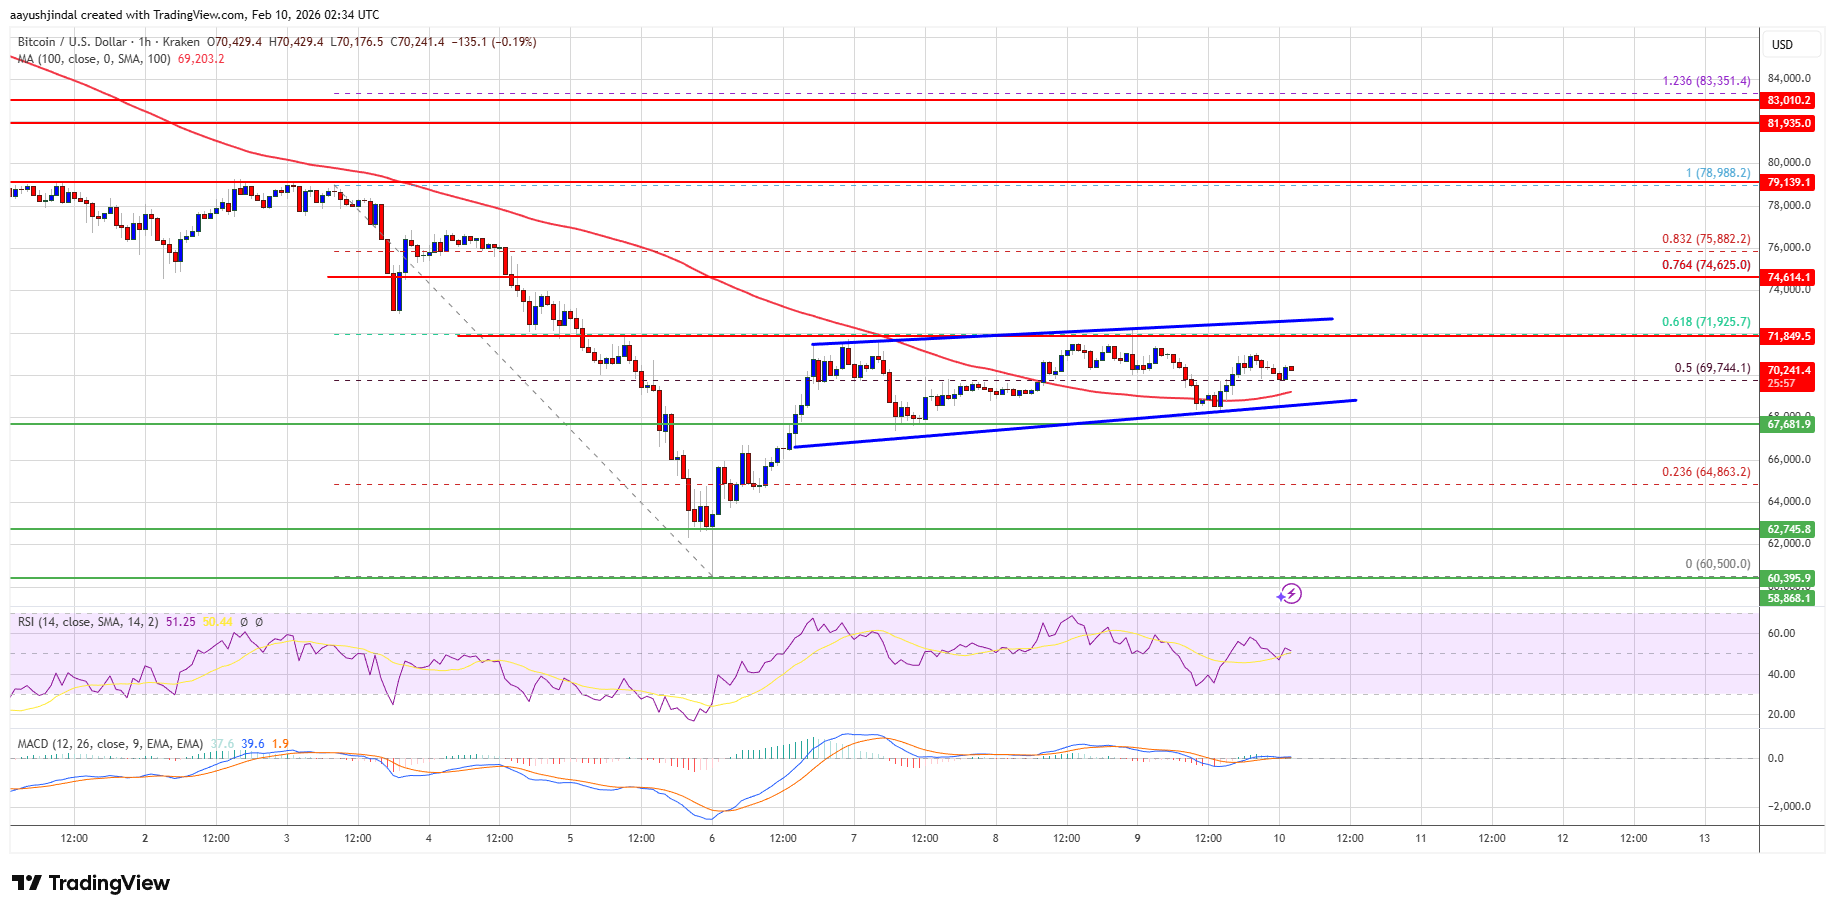
The price is trading above $70,000 and the 100 hourly simple moving average.
There is a rising channel forming with support at $68,800 on the hourly chart of the BTC/USD pair (data feed from Kraken).
The pair might dip again if it trades below the $68,800 and $67,700 levels.
Bitcoin price managed to remain stable above the $66,000 zone. BTC started a recovery wave and was able to climb above the $68,800 resistance zone.
The price surpassed the 50% Fib retracement level of the main slide from the $78,988 swing high to the $60,500 low. However, the bears seem to be active near the $72,000 and $72,500 levels. Besides, there is a rising channel forming with support at $68,800 on the hourly chart of the BTC/USD pair.
Bitcoin is now trading above $70,000 and the 100 hourly simple moving average. If the price remains stable above $68,800, it could attempt a fresh increase. Immediate resistance is near the $72,000 level or the 61.8% Fib retracement level of the main slide from the $78,988 swing high to the $60,500 low.
The first key resistance is near the $72,500 level. A close above the $72,500 resistance might send the price further higher. In the stated case, the price could rise and test the $74,650 resistance. Any more gains might send the price toward the $75,880 level. The next barrier for the bulls could be $76,500 and $77,200.
If Bitcoin fails to rise above the $72,500 resistance zone, it could start another decline. Immediate support is near the $69,400 level. The first major support is near the $68,500 level.
The next support is now near the $67,600 zone. Any more losses might send the price toward the $66,500 support in the near term. The main support now sits at $65,000, below which BTC might struggle to recover in the near term.
Technical indicators:
Hourly MACD – The MACD is now losing pace in the bearish zone.
Hourly RSI (Relative Strength Index) – The RSI for BTC/USD is now above the 50 level.
Major Support Levels – $68,500, followed by $67,600.
Major Resistance Levels – $72,000 and $72,500.
[#item_full_content]NewsBTCRead MoreOn-chain data shows the large Bitcoin holders have been participating in a notable amount of…
Google's quantum paper made headlines with that number. Here's what it means, what's actually at…
Ethereum could outpace Bitcoin by a wide margin over the next four years — at…
Bitcoin is often celebrated as a decentralized network, with mining power distributed globally to ensure…
Bitcoin (BTC) faces a stark downside risk that could send prices below the previous bear…
Crypto analyst Jordan has predicted that the Bitcoin price could rally to $80,000 in the…