Bitcoin price started a fresh decline below the $62,500 zone. BTC is showing bearish signs and might continue to move down if it dips below $61,200.
Bitcoin failed to stay above $63,200 and extended losses.
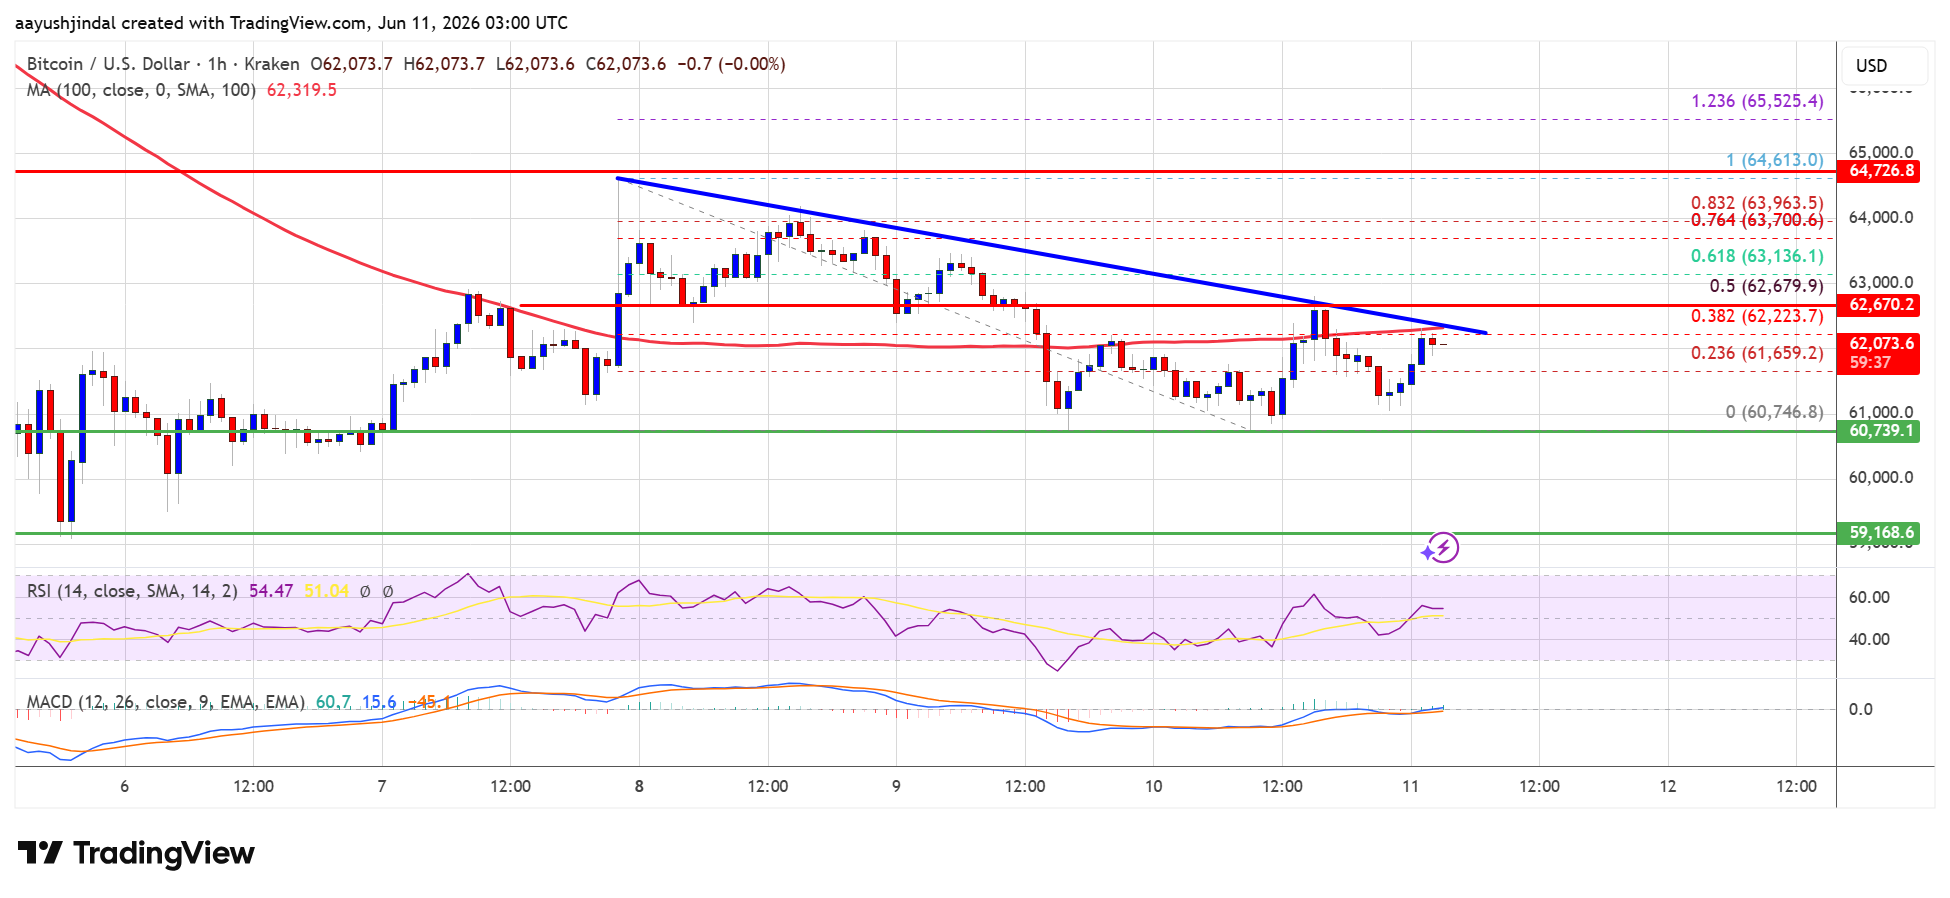
The price is trading below $62,500 and the 100 hourly simple moving average.
There is a bearish trend line forming with resistance near $62,400 on the hourly chart of the BTC/USD pair (data feed from Kraken).
The pair might extend losses if it stays below the $62,500 and $63,500 levels.
Bitcoin price failed to stay above the $63,500 support zone. BTC remained in a bearish zone and extended losses below the $63,200 level. There was a move below the $62,500 level.
The price even dipped below $61,200. A low was formed at $60,746 and the price is still showing many bearish signs. There was a minor increase above the 23.6% Fib retracement level of the downward move from the $64,613 swing high to the $60,746 low.
Bitcoin is now trading below $62,500 and the 100 hourly simple moving average. There is also a bearish trend line forming with resistance near $62,400 on the hourly chart of the BTC/USD pair.
If the price remains stable above $60,750, it could attempt a fresh increase. Immediate resistance is near the $62,500 level and the trend line. The first key resistance is near the $63,200 level or the 61.8% Fib retracement level of the downward move from the $64,613 swing high to the $60,746 low.
A close above the $63,200 resistance might send the price further higher. In the stated case, the price could rise and test the $63,500 resistance. Any more gains might send the price toward the $64,500 level. The next barrier for the bulls could be $65,000.
If Bitcoin fails to rise above the $63,200 resistance zone, it could start another decline. Immediate support is near the $61,650 level.
The first major support is near the $61,200 level. The next support is now near the $60,750 zone. Any more losses might send the price toward the $60,200 support in the near term. The main support now sits at $60,000, below which BTC might struggle to recover in the near term.
Technical indicators:
Hourly MACD – The MACD is now losing pace in the bearish zone.
Hourly RSI (Relative Strength Index) – The RSI for BTC/USD is now above the 50 level.
Major Support Levels – $61,650, followed by $61,200.
Major Resistance Levels – $62,500 and $63,500.
[#item_full_content]NewsBTCRead MoreLuke Gromen says Bitcoin’s failure to break decisively higher may reflect more than weak spot…
Bitcoin fell to its lowest weekly close since the second half of 2024 last week,…
Bitcoin is testing a key demand zone after breaking down from a symmetrical triangle, putting…
As Bitcoin (BTC) hovers near its lowest levels since late 2024, a market observer suggests…
Bitcoin Magazine Strategy (MSTR) CEO Says Bitcoin Sale Was About Market ‘Inoculation,’ Not a Retreat…
BlackRock's IBIT and Fidelity's FBTC are attracting the vast majority of new bitcoin ETF money,…