Bitcoin price is still holding the $117,250 support zone. BTC is consolidating and might attempt to clear the $118,600 resistance zone to gain bullish momentum.
Bitcoin started a downside correction from the $120,000 zone.
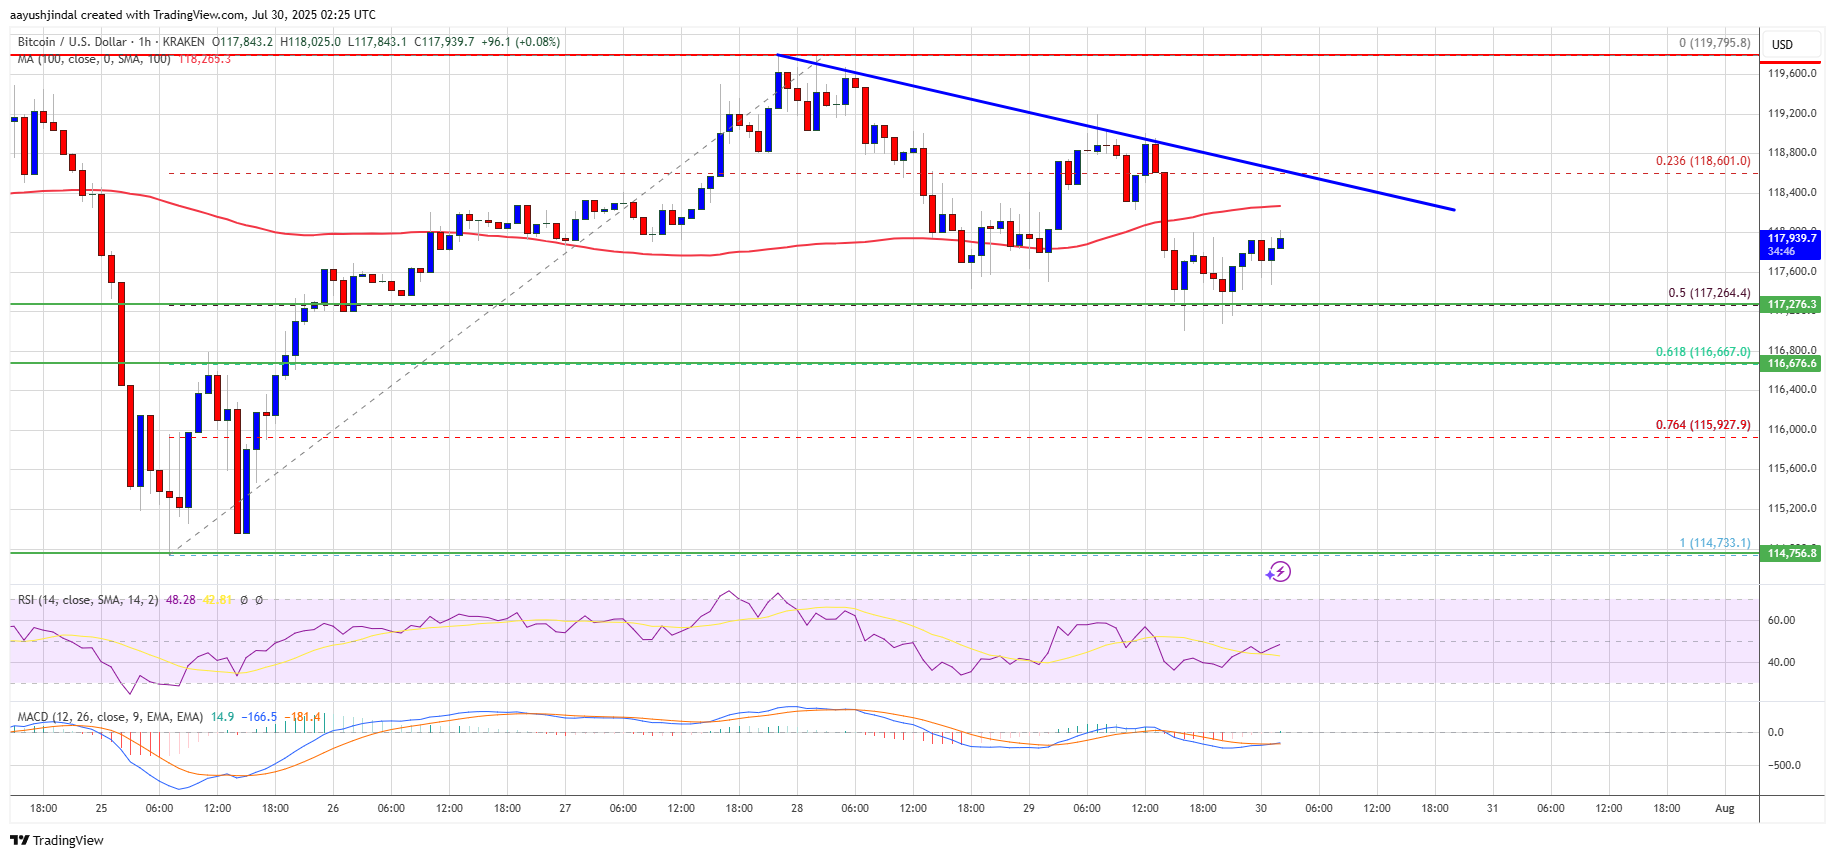
The price is trading below $118,500 and the 100 hourly Simple moving average.
There is a bearish trend line forming with resistance at $118,600 on the hourly chart of the BTC/USD pair (data feed from Kraken).
The pair might start another increase if it clears the $118,600 resistance zone.
Bitcoin price started a fresh increase above the $118,000 zone. BTC climbed above the $118,500 and $118,800 resistance levels to move into a positive zone.
The bulls were able to push the price above the $119,500 resistance. A high was formed at $119,796 and the pair is now correcting gains. There was a move below the 23.6% Fib retracement level of the upward move from the $114,733 swing low to the $119,796 high.
Bitcoin is now trading below $118,500 and the 100 hourly Simple moving average. Immediate resistance on the upside is near the $118,500 level. There is also a bearish trend line forming with resistance at $118,600 on the hourly chart of the BTC/USD pair.
The first key resistance is near the $119,250 level. The next resistance could be $119,800. A close above the $119,800 resistance might send the price further higher. In the stated case, the price could rise and test the $120,500 resistance level. Any more gains might send the price toward the $122,500 level. The main target could be $123,200.
If Bitcoin fails to rise above the $118,600 resistance zone, it could start another decline. Immediate support is near the $117,250 level or the 50% Fib retracement level of the upward move from the $114,733 swing low to the $119,796 high. The first major support is near the $116,650 level.
The next support is now near the $115,950 zone. Any more losses might send the price toward the $114,500 support in the near term. The main support sits at $113,500, below which BTC might continue to move down.
Technical indicators:
Hourly MACD – The MACD is now losing pace in the bullish zone.
Hourly RSI (Relative Strength Index) – The RSI for BTC/USD is now below the 50 level.
Major Support Levels – $117,250, followed by $116,650.
Major Resistance Levels – $118,600 and $119,800.
[#item_full_content]NewsBTCRead MoreTL;DR Bitcoin fell below the $59,000 threshold as macro pressure returned to crypto markets. The…
TL;DR Bitcoin options positioning has shifted toward downside protection, according to Deribit and Block Scholes…
TL;DR Oman has launched Omanhash.om, a state-supervised national Bitcoin mining pool. The pool is described…
Bitcoin Magazine ‘I See Volatility as Opportunity’: Bitcoin Tests Critical Support as Key Level Hangs…
BTC touched its lowest level since September 2024 before rebounding to $59,770, while ETH slipped…
Your day-ahead look for June 26, 2026Read MoreCoinDesk: Bitcoin, Ethereum, Crypto News and Price Data[#item_full_content]