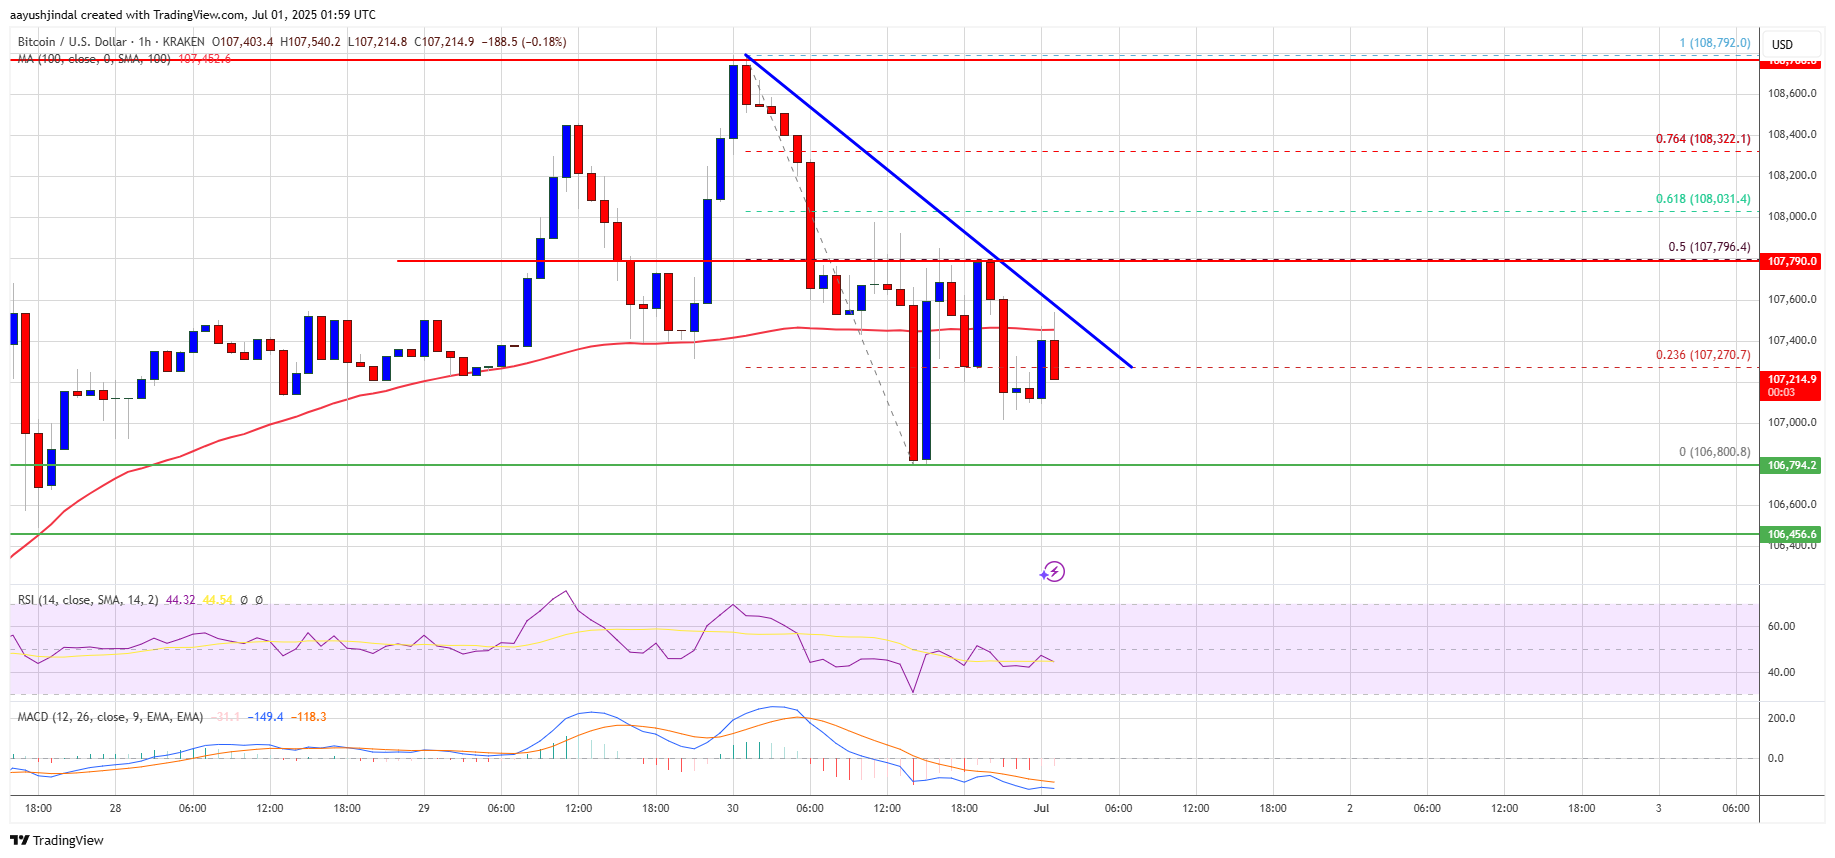
Bitcoin price started trading in a range below the $108,800 zone. BTC is now consolidating and might aim for a move above the $108,000 resistance.
Bitcoin started a downside correction from the $108,800 zone.
The price is trading below $107,500 and the 100 hourly Simple moving average.
There is a bearish trend line forming with resistance at $107,400 on the hourly chart of the BTC/USD pair (data feed from Kraken).
The pair could start a fresh increase if it stays above the $105,500 zone.
Bitcoin price started a fresh increase above the $105,500 zone. BTC gained pace and was able to climb above the $106,500 and $107,200 levels to enter a positive zone.
The bulls pushed the price above the $108,000 resistance and the price tested the $108,800 zone. A high was formed at $108,792 and the price recently corrected gains. There was a move below the $107,500 level. A low was formed at $106,800 and the price is now consolidating losses.
There was a recovery above the 23.6% Fib retracement level of the downward move from the $108,792 swing high to the $106,800 low. Bitcoin is now trading below $107,500 and the 100 hourly Simple moving average.
On the upside, immediate resistance is near the $107,400 level. There is also a bearish trend line forming with resistance at $107,400 on the hourly chart of the BTC/USD pair. The first key resistance is near the $108,000 level and the 50% Fib level of the downward move from the $108,792 swing high to the $106,800 low.
A close above the $108,000 resistance might send the price further higher. In the stated case, the price could rise and test the $108,800 resistance level. Any more gains might send the price toward the $110,000 level.
If Bitcoin fails to rise above the $108,000 resistance zone, it could start another decline. Immediate support is near the $106,800 level. The first major support is near the $106,500 level.
The next support is now near the $105,500 zone. Any more losses might send the price toward the $105,000 support in the near term. The main support sits at $103,500, below which BTC might gain bearish momentum.
Technical indicators:
Hourly MACD – The MACD is now losing pace in the bearish zone.
Hourly RSI (Relative Strength Index) – The RSI for BTC/USD is now below the 50 level.
Major Support Levels – $106,800, followed by $106,500.
Major Resistance Levels – $108,000 and $108,800.
[#item_full_content]NewsBTCRead MoreBitcoin (BTC) has officially entered a new bear market after suffering a steep 50% decline…
On-chain data shows the Bitcoin Realized Loss has spiked to its highest level since November…
Bitcoin Magazine Strategy ($MSTR) Soars 25% as Bitcoin Rebounds Shares of Strategy ($MSTR) surged sharply…
Bitcoin’s market shook hard on a single day of trading, sending prices tumbling to $65,000…
Bitcoin Magazine Michael Saylor Says Strategy ($MSTR) Will Lead Global Bitcoin Effort Against Quantum Threats…
Bitcoin Magazine Bitcoin Price Roars Above $71,000 After Days of Sell-Offs The bitcoin price rebounded…