Bitcoin price failed to settle above $23,500 and corrected lower. BTC is trading above $22,400, but it is now trading below the 100 hourly SMA.
Bitcoin is slowly moving lower from the $23,500 resistance zone.
The price is trading below $23,000 and the 100 hourly simple moving average.
There is a key contracting triangle forming with resistance near $23,000 on the hourly chart of the BTC/USD pair (data feed from Kraken).
The pair could start a fresh increase if it clears the $23,000 resistance zone.
Bitcoin price attempted a fresh increase above the $23,500 resistance zone. However, BTC struggled to gain bullish momentum above the $23,800 level. A new yearly high was formed near $23,829 and the price started a downside correction.
There was a drop below the $23,200 and $23,000 support levels. The price even spiked below $22,500 and traded as low as $22,492. It is now consolidating losses above $22,500.
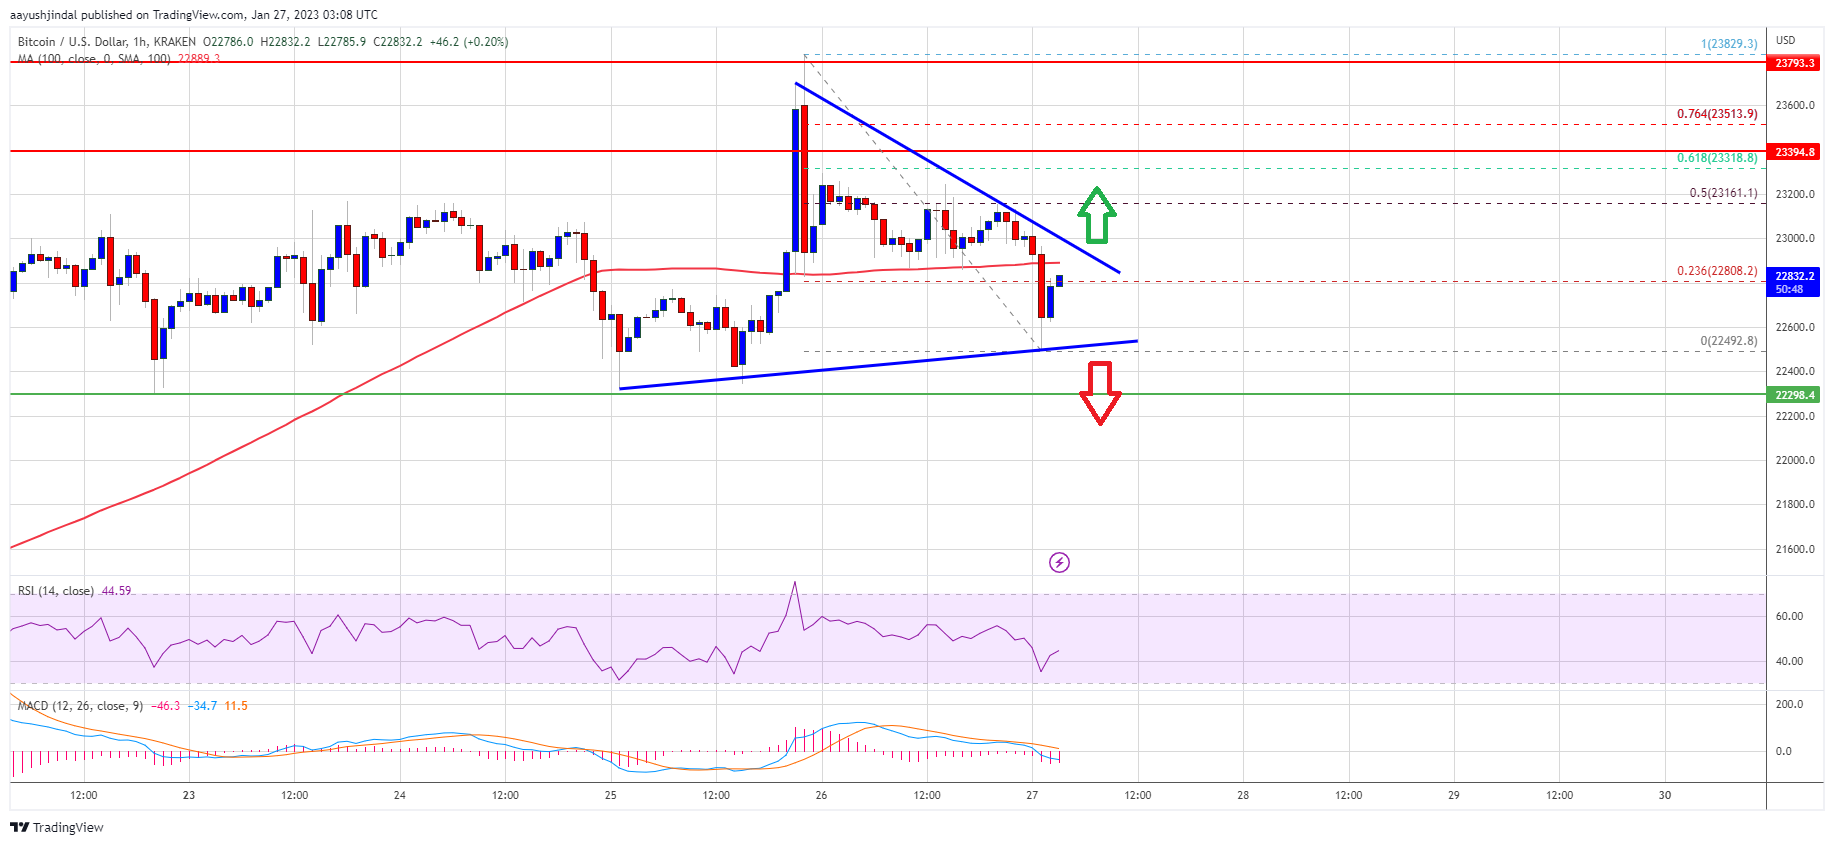
Bitcoin price is now trading below $23,000 and the 100 hourly simple moving average. There is also a key contracting triangle forming with resistance near $23,000 on the hourly chart of the BTC/USD pair.
It is slowly moving above the 23.6% Fib retracement level of the recent decline from the $23,829 swing high to $22,492 low. An immediate resistance is near the $23,000 level, the 100 hourly simple moving average, and the triangle trend line.
Source: BTCUSD on TradingView.com
The next major resistance is near the $23,150 zone or the 50% Fib retracement level of the recent decline from the $23,829 swing high to $22,492 low, above which the price might gain bullish momentum. In the stated case, the price may perhaps rise towards the $23,800 level. The next resistance could be near the $24,200 level. Any more gains might send btc price towards the $25,000 level.
If bitcoin price fails to clear the $23,000 resistance, it could continue to move down. An immediate support on the downside is near the $22,500 zone and the triangle lower trend line.
The next major support is near the $22,400 zone. A downside break below the $22,400 level might send the price towards the $22,000 level. Any more losses might send the price to $21,250 in the near term.
Technical indicators:
Hourly MACD – The MACD is now losing pace in the bullish zone.
Hourly RSI (Relative Strength Index) – The RSI for BTC/USD is now below the 50 level.
Major Support Levels – $22,500, followed by $22,400.
Major Resistance Levels – $23,000, $23,150 and $23,500.
Bitcoin price failed to settle above $23,500 and corrected lower. BTC is trading above $22,400, but it is now trading below the 100 hourly SMA.
Bitcoin is slowly moving lower from the $23,500 resistance zone.
The price is trading below $23,000 and the 100 hourly simple moving average.
There is a key contracting triangle forming with resistance near $23,000 on the hourly chart of the BTC/USD pair (data feed from Kraken).
The pair could start a fresh increase if it clears the $23,000 resistance zone.
Bitcoin price attempted a fresh increase above the $23,500 resistance zone. However, BTC struggled to gain bullish momentum above the $23,800 level. A new yearly high was formed near $23,829 and the price started a downside correction.
There was a drop below the $23,200 and $23,000 support levels. The price even spiked below $22,500 and traded as low as $22,492. It is now consolidating losses above $22,500.
Bitcoin price is now trading below $23,000 and the 100 hourly simple moving average. There is also a key contracting triangle forming with resistance near $23,000 on the hourly chart of the BTC/USD pair.
It is slowly moving above the 23.6% Fib retracement level of the recent decline from the $23,829 swing high to $22,492 low. An immediate resistance is near the $23,000 level, the 100 hourly simple moving average, and the triangle trend line.
Source: BTCUSD on TradingView.com
The next major resistance is near the $23,150 zone or the 50% Fib retracement level of the recent decline from the $23,829 swing high to $22,492 low, above which the price might gain bullish momentum. In the stated case, the price may perhaps rise towards the $23,800 level. The next resistance could be near the $24,200 level. Any more gains might send btc price towards the $25,000 level.
If bitcoin price fails to clear the $23,000 resistance, it could continue to move down. An immediate support on the downside is near the $22,500 zone and the triangle lower trend line.
The next major support is near the $22,400 zone. A downside break below the $22,400 level might send the price towards the $22,000 level. Any more losses might send the price to $21,250 in the near term.
Technical indicators:
Hourly MACD – The MACD is now losing pace in the bullish zone.
Hourly RSI (Relative Strength Index) – The RSI for BTC/USD is now below the 50 level.
Major Support Levels – $22,500, followed by $22,400.
Major Resistance Levels – $23,000, $23,150 and $23,500.
Tags: bitcoinbitcoin pricebtcusdBTCUSDTxbtusd
NewsBTCRead More
The Japanese firm, now the world's third largest publicly traded bitcoin holder, reported stronger Bitcoin…
Post ContentRead MoreCoinDesk: Bitcoin, Ethereum, Crypto News and Price Data[#item_full_content]
Long-term holding wallets have shifted to net accumulation from net distribution, according to Glassnode.Read MoreCoinDesk:…
Bitcoin climbed back above $60,000 for the first time in over a week after Fed…
Bitcoin Magazine Bitcoin Price Reclaims $60,000 As Strategy (MSTR) and Strive (ASST) Jump More Than…
Bitcoin Magazine AI’s Bitcoin Moment: Why the Open-Source Fight Looks Like Crypto Back in 2014…