Bitcoin price failed to settle above $23,500 and corrected lower. BTC is trading above $22,400, but it is now trading below the 100 hourly SMA.
Bitcoin is slowly moving lower from the $23,500 resistance zone.
The price is trading below $23,000 and the 100 hourly simple moving average.
There is a key contracting triangle forming with resistance near $23,000 on the hourly chart of the BTC/USD pair (data feed from Kraken).
The pair could start a fresh increase if it clears the $23,000 resistance zone.
Bitcoin price attempted a fresh increase above the $23,500 resistance zone. However, BTC struggled to gain bullish momentum above the $23,800 level. A new yearly high was formed near $23,829 and the price started a downside correction.
There was a drop below the $23,200 and $23,000 support levels. The price even spiked below $22,500 and traded as low as $22,492. It is now consolidating losses above $22,500.
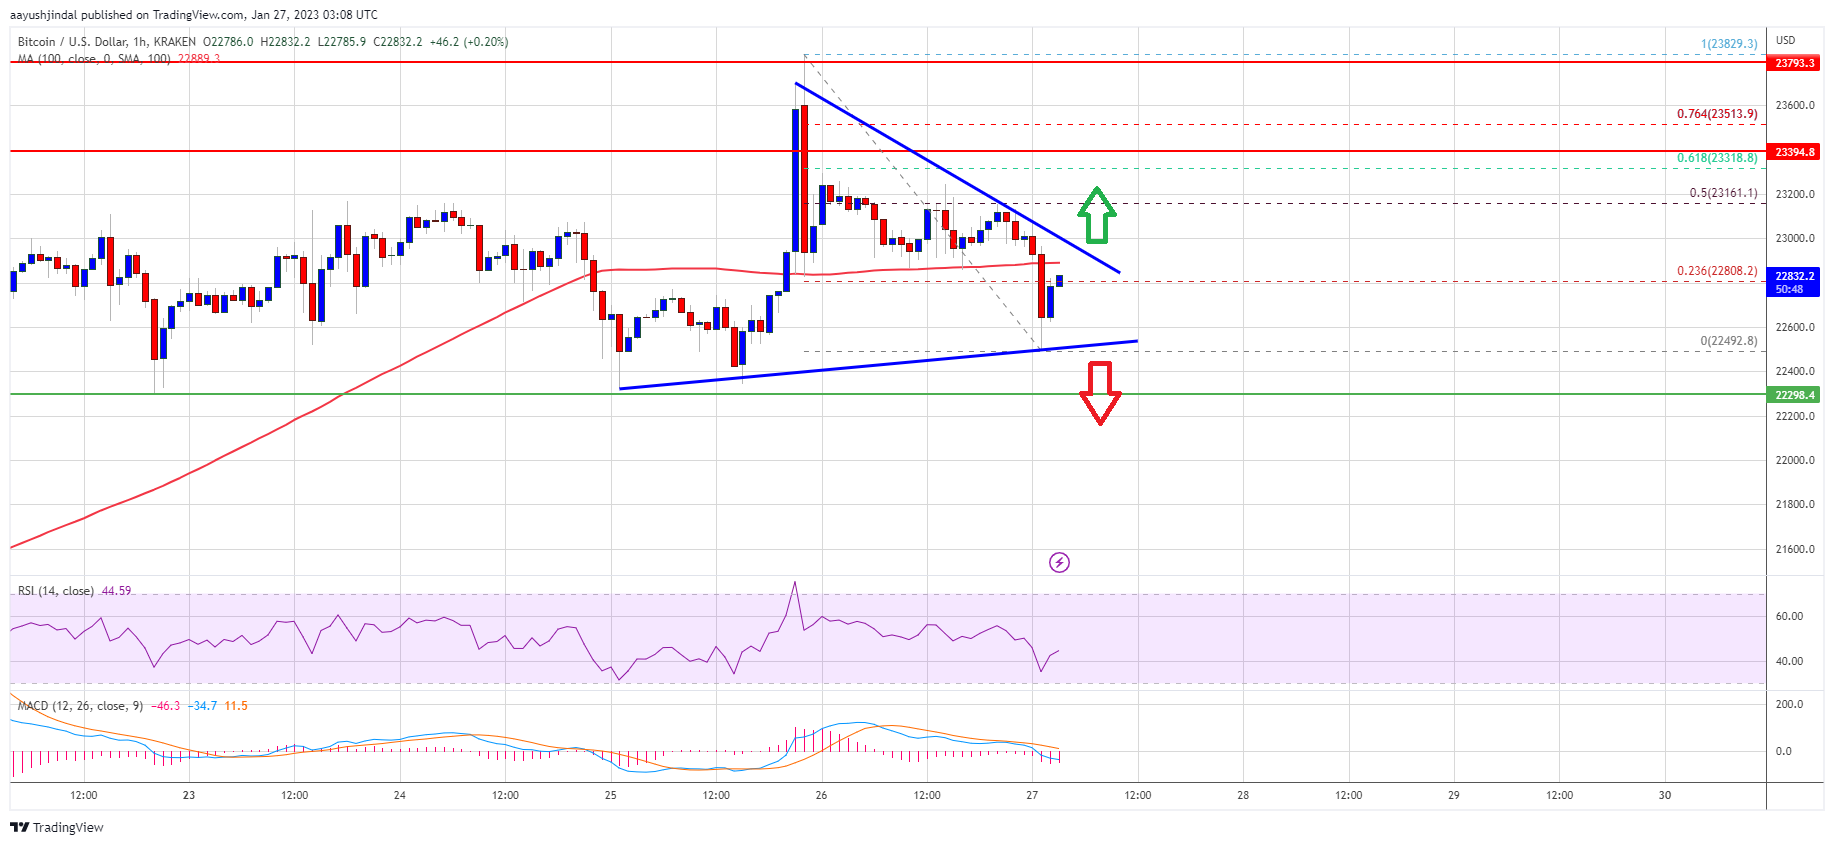
Bitcoin price is now trading below $23,000 and the 100 hourly simple moving average. There is also a key contracting triangle forming with resistance near $23,000 on the hourly chart of the BTC/USD pair.
It is slowly moving above the 23.6% Fib retracement level of the recent decline from the $23,829 swing high to $22,492 low. An immediate resistance is near the $23,000 level, the 100 hourly simple moving average, and the triangle trend line.
Source: BTCUSD on TradingView.com
The next major resistance is near the $23,150 zone or the 50% Fib retracement level of the recent decline from the $23,829 swing high to $22,492 low, above which the price might gain bullish momentum. In the stated case, the price may perhaps rise towards the $23,800 level. The next resistance could be near the $24,200 level. Any more gains might send btc price towards the $25,000 level.
If bitcoin price fails to clear the $23,000 resistance, it could continue to move down. An immediate support on the downside is near the $22,500 zone and the triangle lower trend line.
The next major support is near the $22,400 zone. A downside break below the $22,400 level might send the price towards the $22,000 level. Any more losses might send the price to $21,250 in the near term.
Technical indicators:
Hourly MACD – The MACD is now losing pace in the bullish zone.
Hourly RSI (Relative Strength Index) – The RSI for BTC/USD is now below the 50 level.
Major Support Levels – $22,500, followed by $22,400.
Major Resistance Levels – $23,000, $23,150 and $23,500.
Bitcoin price failed to settle above $23,500 and corrected lower. BTC is trading above $22,400, but it is now trading below the 100 hourly SMA.
Bitcoin is slowly moving lower from the $23,500 resistance zone.
The price is trading below $23,000 and the 100 hourly simple moving average.
There is a key contracting triangle forming with resistance near $23,000 on the hourly chart of the BTC/USD pair (data feed from Kraken).
The pair could start a fresh increase if it clears the $23,000 resistance zone.
Bitcoin price attempted a fresh increase above the $23,500 resistance zone. However, BTC struggled to gain bullish momentum above the $23,800 level. A new yearly high was formed near $23,829 and the price started a downside correction.
There was a drop below the $23,200 and $23,000 support levels. The price even spiked below $22,500 and traded as low as $22,492. It is now consolidating losses above $22,500.
Bitcoin price is now trading below $23,000 and the 100 hourly simple moving average. There is also a key contracting triangle forming with resistance near $23,000 on the hourly chart of the BTC/USD pair.
It is slowly moving above the 23.6% Fib retracement level of the recent decline from the $23,829 swing high to $22,492 low. An immediate resistance is near the $23,000 level, the 100 hourly simple moving average, and the triangle trend line.
Source: BTCUSD on TradingView.com
The next major resistance is near the $23,150 zone or the 50% Fib retracement level of the recent decline from the $23,829 swing high to $22,492 low, above which the price might gain bullish momentum. In the stated case, the price may perhaps rise towards the $23,800 level. The next resistance could be near the $24,200 level. Any more gains might send btc price towards the $25,000 level.
If bitcoin price fails to clear the $23,000 resistance, it could continue to move down. An immediate support on the downside is near the $22,500 zone and the triangle lower trend line.
The next major support is near the $22,400 zone. A downside break below the $22,400 level might send the price towards the $22,000 level. Any more losses might send the price to $21,250 in the near term.
Technical indicators:
Hourly MACD – The MACD is now losing pace in the bullish zone.
Hourly RSI (Relative Strength Index) – The RSI for BTC/USD is now below the 50 level.
Major Support Levels – $22,500, followed by $22,400.
Major Resistance Levels – $23,000, $23,150 and $23,500.
Tags: bitcoinbitcoin pricebtcusdBTCUSDTxbtusd
NewsBTCRead More
An interesting statement from Grant Cardone has led to a different kind of conversation. According…
Bitcoin Magazine Bitcoin Fear and Greed Index Hits Extreme Fear at 13 Out of 100…
Bitcoin fell to its lowest level in over two weeks as traders adopted a more…
Bitcoin Magazine Bitcoin Price Slides to Two-Week Low as Liquidations Top $300 Million and Macro…
Bitcoin fell below $67,000 and ether dropped toward $2,000 as equities weakened, oil topped $100…
Your day-ahead look for March 27, 2026Read MoreCoinDesk: Bitcoin, Ethereum, Crypto News and Price Data[#item_full_content]