Bitcoin price started a consolidation phase near the $58,500 level. BTC must clear the $60,500 resistance to start a recovery wave in the near term.
Bitcoin tested the $58,000 zone before there was a minor recovery.
The price is trading below $62,000 and the 100 hourly Simple moving average.
There is a major bearish trend line forming with resistance at $60,200 on the hourly chart of the BTC/USD pair (data feed from Kraken).
The pair might slip again if there is no move above the $60,500 resistance.
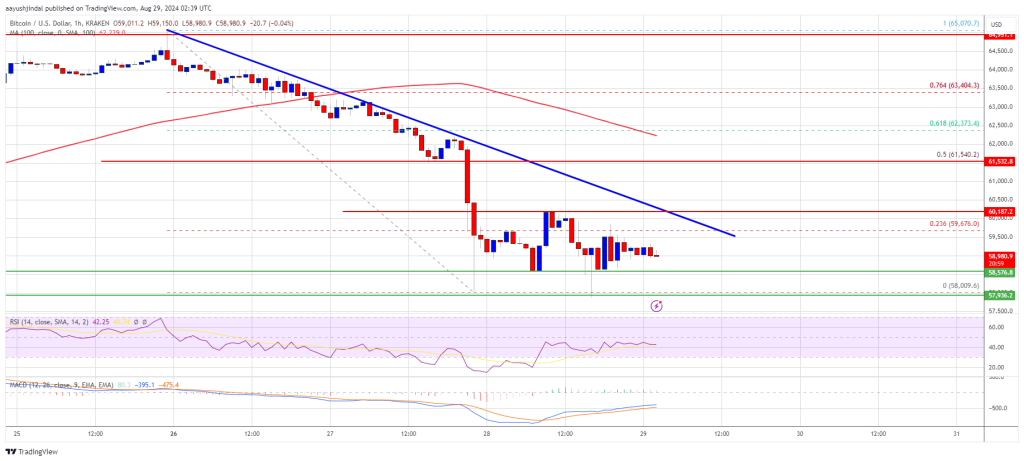
Bitcoin price gained bearish momentum below the $62,500 level. The price even dived below the $60,000 level. Finally, the bulls appeared near the $58,000 level.
A low was formed at $58,009 and the price is now consolidating losses. There was a minor recovery wave above the $58,500 and $58,800 levels. The price tested the 23.6% Fib retracement level of the downward wave from the $65,070 swing high to the $58,009 low.
Bitcoin is now trading below $61,200 and the 100 hourly Simple moving average. On the upside, the price could face resistance near the $59,650 level. The first key resistance is near the $60,000 level. There is also a major bearish trend line forming with resistance at $60,200 on the hourly chart of the BTC/USD pair.
A clear move above the $60,200 resistance might send the price further higher in the coming sessions. The next key resistance could be $61,500. It is close to the 50% Fib retracement level of the downward wave from the $65,070 swing high to the $58,009 low.
A close above the $61,500 resistance might spark more upsides. In the stated case, the price could rise and test the $62,500 resistance.
If Bitcoin fails to rise above the $60,200 resistance zone, it could continue to move down. Immediate support on the downside is near the $58,550 level.
The first major support is $58,000. The next support is now near the $57,650 zone. Any more losses might send the price toward the $56,500 support in the near term.
Technical indicators:
Hourly MACD – The MACD is now losing pace in the bearish zone.
Hourly RSI (Relative Strength Index) – The RSI for BTC/USD is now below the 50 level.
Major Support Levels – $58,550, followed by $58,000.
Major Resistance Levels – $60,200, and $61,500.
[#item_full_content]NewsBTCRead MoreThe Nasdaq-listed Korean media company once lined up $1 billion in financing to buy 10,000…
The bank said Strategy's bitcoin sales policy adds avoidable market uncertainty and should be replaced…
Bitcoin Magazine Metaplanet Adds 2,823 Bitcoin, Reaches 43,000 BTC and Becomes World’s Third-Largest Corporate Treasury…
Bitcoin and major cryptocurrencies rebounded on dovish Federal Reserve signals, with speculative tokens like Memecore’s…
Your day-ahead look for July 2, 2026Read MoreCoinDesk: Bitcoin, Ethereum, Crypto News and Price Data[#item_full_content]
Bitcoin rose more than 4% to trade above $61,000, its strongest level in over a…