Bitcoin price is consolidating above the $26,550 level. BTC could correct higher, but upsides might be capped near the $27,400 and $27,500 resistance levels.
Bitcoin is finding bids near the $26,550 level.
The price is trading below $27,200 and the 100 hourly Simple moving average.
There is a key bearish trend line forming with resistance near $26,200 on the hourly chart of the BTC/USD pair (data feed from Kraken).
The pair could correct higher, but the bears might remain active near the $27,500 zone.
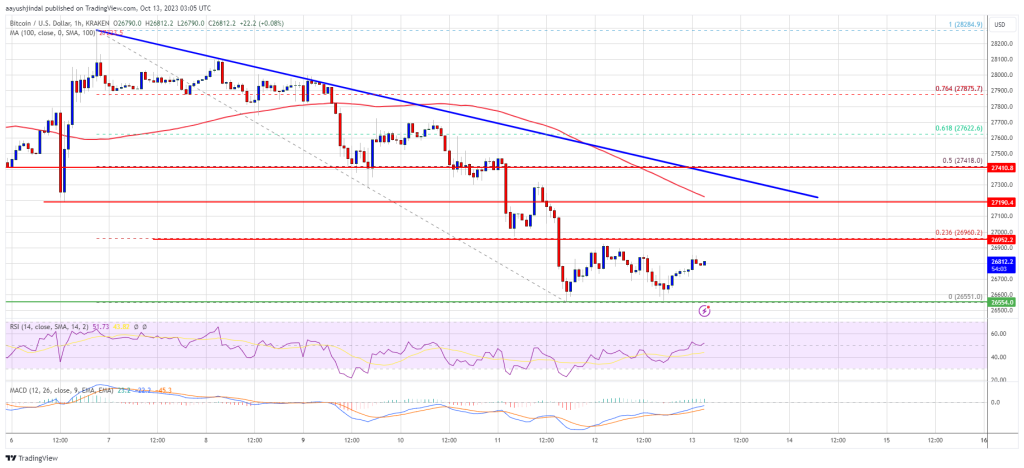
Bitcoin price started a fresh decline from the $27,500 resistance. BTC traded below the $27,000 level to enter a bearish zone. Finally, the bulls appeared above the $26,500 support.
The price remained well-bid near the $26,550 level. The bears made two attempts to push the price below $26,550, but they failed. A low is formed near $26,551 and the price is now consolidating losses below the 23.6% Fib retracement level of the downward move from the $28,285 swing high to the $26,551 low.
Bitcoin is now trading below $27,200 and the 100 hourly Simple moving average. There is also a key bearish trend line forming with resistance near $26,200 on the hourly chart of the BTC/USD pair.
Immediate resistance is near the $26,950 level. The first major resistance is $27,200 and the 100 hourly Simple moving average. The next key resistance could be $27,400 and the trend line. It is close to the 50% Fib retracement level of the downward move from the $28,285 swing high to the $26,551 low.
Source: BTCUSD on TradingView.com
A close above the $27,500 resistance might start a steady increase toward the $28,000 level. The main hurdle is still $28,500, above which the price could start another increase. In the stated case, the price could rise toward the $30,000 resistance.
If Bitcoin fails to recover higher above the $27,200 resistance, there could be more losses. Immediate support on the downside is near the $26,550 level.
The next major support is near the $26,500 level. A downside break and close below the $26,500 support might send the price further lower. The next support sits at $26,000.
Technical indicators:
Hourly MACD – The MACD is now losing pace in the bearish zone.
Hourly RSI (Relative Strength Index) – The RSI for BTC/USD is now above the 50 level.
Major Support Levels – $26,550, followed by $26,500.
Major Resistance Levels – $27,200, $27,400, and $27,500.
[#item_full_content]NewsBTCRead MoreBitcoin price started a recovery wave above $70,000. BTC is now consolidating above $70,200 and…
Bitcoin remains locked in a tight range, leaving traders uncertain about its next major move.…
Bitcoin’s miner supply picture remains tighter than in past cycles, but not tight enough to…
A crypto analyst has issued a bold long-term forecast for Bitcoin, predicting that a capital…
Bitcoin is holding above $70,000. The number looks resilient. The geography behind it tells a…
Crypto analyst Crypto Patel has outlined a roadmap for how Bitcoin could rally to $300,000.…