Bitcoin price failed again to clear the $53,000 resistance. BTC is now back below $52,000 and there are chances of a downside break below the $50,500 support.
Bitcoin price is struggling to clear the $52,000 resistance zone.
The price is trading below $52,000 and the 100 hourly Simple moving average.
There is a connecting bearish trend line forming with resistance at $51,550 on the hourly chart of the BTC/USD pair (data feed from Kraken).
The pair could gain bearish momentum if there is a move below the $50,500 support.
Bitcoin price failed to start a fresh increase above the $52,200 resistance zone. BTC settled below $52,000 and slowly moved lower. There was a drop below the $51,500 level.
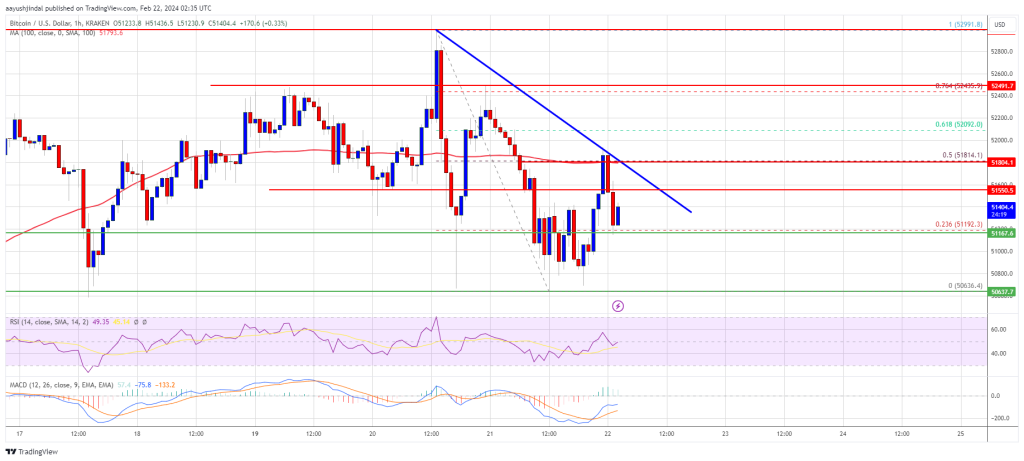
The price even revisited the $50,500 support zone. A low was formed at $50,636 and the price is now attempting a recovery wave. There was a move above the $51,000 level. The price spiked toward the 50% Fib retracement level of the downward move from the $52,991 swing high to the $50,636 low.
Bitcoin is now trading below $52,000 and the 100 hourly Simple moving average. There is also a connecting bearish trend line forming with resistance at $51,550 on the hourly chart of the BTC/USD pair.
Immediate resistance is near the $51,550 level. The next key resistance could be $51,800, above which the price could rise toward the $52,500 resistance zone. It is near the 76.4% Fib retracement level of the downward move from the $52,991 swing high to the $50,636 low.
Source: BTCUSD on TradingView.com
The main resistance is now near the $53,000 level. A clear move above the $53,000 resistance could send the price toward the $53,500 resistance. The next resistance could be near the $54,200 level.
If Bitcoin fails to rise above the $52,000 resistance zone, it could start another decline in the near term. Immediate support on the downside is near the $51,100 level.
The first major support is $50,500. If there is a close below $50,500, the price could gain bearish momentum. In the stated case, the price could decline toward the $49,200 support zone, below which the price might turn bearish in the short term.
Technical indicators:
Hourly MACD – The MACD is now gaining pace in the bearish zone.
Hourly RSI (Relative Strength Index) – The RSI for BTC/USD is now above the 50 level.
Major Support Levels – $51,100, followed by $50,500.
Major Resistance Levels – $51,550, $51,800, and $52,500.
[#item_full_content]NewsBTCRead MoreTL;DR Bitcoin options positioning has shifted toward downside protection, according to Deribit and Block Scholes…
TL;DR Oman has launched Omanhash.om, a state-supervised national Bitcoin mining pool. The pool is described…
Bitcoin Magazine ‘I See Volatility as Opportunity’: Bitcoin Tests Critical Support as Key Level Hangs…
BTC touched its lowest level since September 2024 before rebounding to $59,770, while ETH slipped…
Your day-ahead look for June 26, 2026Read MoreCoinDesk: Bitcoin, Ethereum, Crypto News and Price Data[#item_full_content]
The real estate investor pitched his model as a treasury company backed by cash-flowing property…