Bitcoin price is holding the key support at $60,000. BTC could start another increase and rise toward the range resistance at $63,500.
Bitcoin is still trading in a range between $60,000 and $63,500.
The price is trading above $61,500 and the 100 hourly Simple moving average.
There was a break above a connecting bearish trend line with resistance at $61,550 on the hourly chart of the BTC/USD pair (data feed from Kraken).
The pair could gain bullish momentum if it clears $62,200 and $62,500.
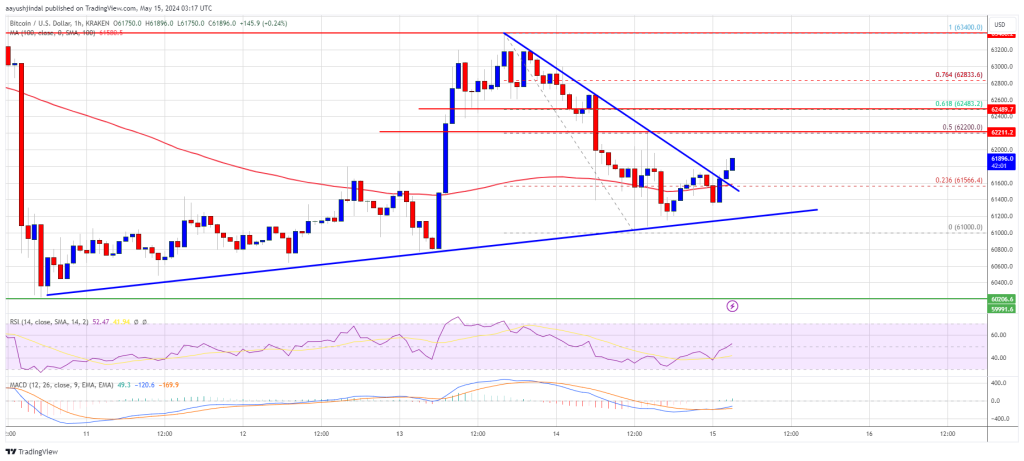
Bitcoin price started another decline from the $63,500 resistance zone. BTC traded below the $62,500 and $62,200 support levels. A low was formed at $61,000 and the price started a recovery wave.
There was a move above the $61,250 and $61,500 levels. Besides, there was a break above a connecting bearish trend line with resistance at $61,550 on the hourly chart of the BTC/USD pair. There was a move above the 23.6% Fib retracement level of the recent decline from the $63,400 swing high to the $61,000 low.
Bitcoin is still trading above $61,500 and the 100 hourly Simple moving average. Immediate resistance is near the $62,200 level or the 50% Fib retracement level of the recent decline from the $63,400 swing high to the $61,000 low.
The first major resistance could be $62,500. The next key resistance could be $63,000. A clear move above the $63,000 resistance might send the price higher. The main resistance now sits at $63,500. If there is a close above the $63,500 resistance zone, the price could continue to move up. In the stated case, the price could rise toward $65,000.
If Bitcoin fails to climb above the $62,500 resistance zone, it could start another decline. Immediate support on the downside is near the $61,550 level and the 100 hourly Simple moving average.
The first major support is $61,000. If there is a close below $61,000, the price could start to drop toward $60,400. Any more losses might send the price toward the $60,000 support zone in the near term.
Technical indicators:
Hourly MACD – The MACD is now gaining pace in the bullish zone.
Hourly RSI (Relative Strength Index) – The RSI for BTC/USD is now above the 50 level.
Major Support Levels – $61,550, followed by $61,000.
Major Resistance Levels – $62,200, $62,500, and $63,500.
[#item_full_content]NewsBTCRead MoreBitcoin Magazine Labor Department Proposal Could Open 401(k)s to Bitcoin and Alternative Assets The U.S.…
Analyst Willy Woo has highlighted how some old-school Bitcoin on-chain models could suggest a bottoming…
Bitcoin Magazine U.S. Senators Unveil ‘Mined in America Act’ to Reshore BTC Mining, Codify Bitcoin…
The XRP price traded at around $1.30 on Monday as markets consolidated and Bitcoin (BTC)…
The new rollout converts BTC to dollars by default for small businesses, aiming to embed…
The Bitcoin price could be on the verge of a major surge as new discussions…