Bitcoin price is gaining pace above the $30,000 resistance. BTC is showing positive signs and might rally further above toward the $31,200 level.
Bitcoin started a fresh increase above the $28,500 and $28,800 resistance levels.
The price is trading above $30,000 and the 100 hourly Simple moving average.
There is a key bullish trend line forming with support near $30,000 on the hourly chart of the BTC/USD pair (data feed from Kraken).
The pair could continue to rise toward the $31,200 resistance level.
Bitcoin price formed a support base above the $27,500 level. BTC started a steady increase and cleared a few hurdles near the $28,500 resistance zone.
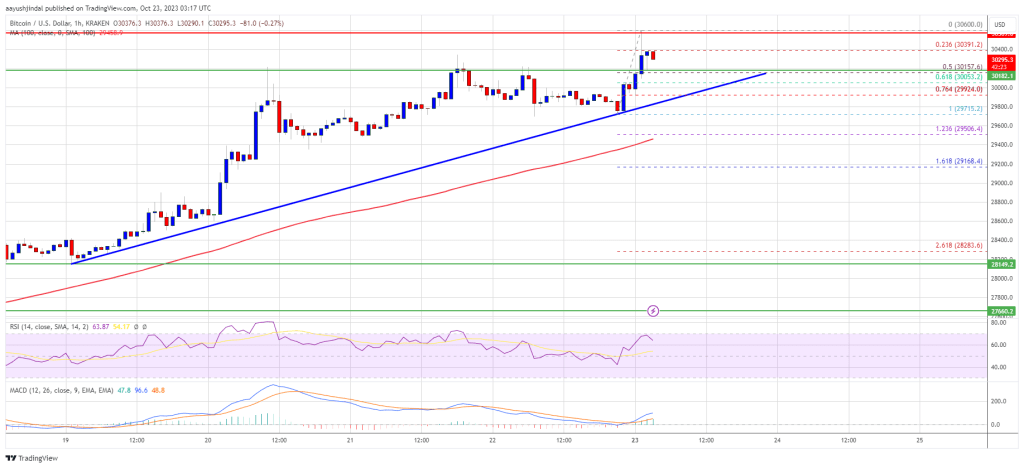
The bulls gained strength and managed to push the price above the main $30,000 resistance zone. A new multi-week high is formed near $30,600 and the price is now consolidating gains. There was a minor decline below the 23.6% Fib retracement level of the upward move from the $29,715 swing low to the $30,600 high.
Bitcoin is now trading above $30,000 and the 100 hourly Simple moving average. There is also a key bullish trend line forming with support near $30,000 on the hourly chart of the BTC/USD pair. The trend line is near the 61.8% Fib retracement level of the upward move from the $29,715 swing low to the $30,600 high.
Source: BTCUSD on TradingView.com
On the upside, immediate resistance is near the $30,400 level. The next key resistance could be near $30,600. A clear move above the recent high might send the price toward the $31,200 resistance. The next key resistance could be $32,000. Any more gains might send BTC toward the $33,200 level in the coming sessions.
If Bitcoin fails to rise above the $30,600 resistance zone, it could start a downside correction. Immediate support on the downside is near the $30,150 level.
The next major support is near the $30,000 level and the trend line. If there is a move below the trend line support, the price may perhaps decline toward the $29,500 level or the 100 hourly Simple moving average.
Technical indicators:
Hourly MACD – The MACD is now gaining pace in the bullish zone.
Hourly RSI (Relative Strength Index) – The RSI for BTC/USD is now above the 50 level.
Major Support Levels – $30,150, followed by $30,000.
Major Resistance Levels – $30,400, $30,600, and $31,200.
[#item_full_content]NewsBTCRead MoreData shows the Bitcoin perpetual futures market has seen a negative Funding Rate recently, suggesting…
Despite the crypto market’s renewed weakness on Thursday, a new AI-driven market model produced by…
The recent price action echoes the November–January pattern, showing weak conviction among the “buy the…
Morgan Stanley has filed to launch a spot Bitcoin ETF with the ticker MSBT and…
Oil prices slipped as major economies announced joint efforts to stabilize energy markets.Read MoreCoinDesk: Bitcoin,…
BTQ Technologies moved a key Bitcoin (BTC) security proposal from theory to practice on Thursday,…