Bitcoin price tested the $65,000 support zone. BTC is now rising and attempting a fresh increase above the $70,000 resistance zone in the near term.
Bitcoin price is showing a few positive signs from the $65,000 zone.
The price is trading below $70,000 and the 100 hourly Simple moving average.
There was a break above a major bearish trend line with resistance at $67,100 on the hourly chart of the BTC/USD pair (data feed from Kraken).
The pair could gain bullish momentum if it clears the $70,000 resistance zone in the near term.
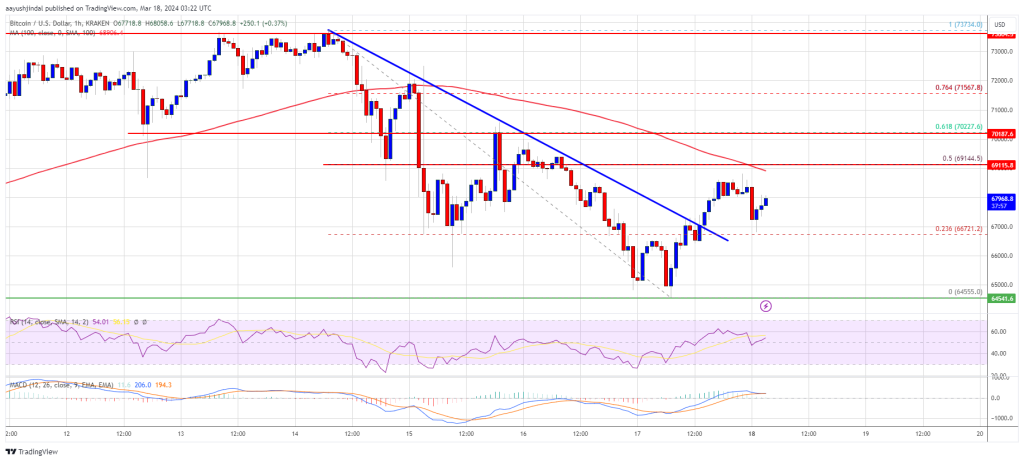
Bitcoin price started a downside correction from the $73,500 zone. There was a steady decline below the $70,000 support zone and the bears pushed the price below $68,000.
Finally, the price tested the $65,000 support zone. A low was formed at $64,555 and the price is now attempting a fresh increase. There was a move above the $66,500 resistance zone. The price climbed above the 23.6% Fib retracement level of the downward move from the $73,734 swing high to the $64,555 low.
There was also a break above a major bearish trend line with resistance at $67,100 on the hourly chart of the BTC/USD pair. Bitcoin is now trading below $70,000 and the 100 hourly Simple moving average.
Immediate resistance is near the $69,200 level or the 50% Fib retracement level of the downward move from the $73,734 swing high to the $64,555 low. The next key resistance could be $70,000, above which the price could rise toward the $71,200 resistance zone.
Source: BTCUSD on TradingView.com
If there is a clear move above the $71,200 resistance zone, the price could even attempt a move above the $72,000 resistance zone. Any more gains might send the price toward the $73,500 level.
If Bitcoin fails to rise above the $70,000 resistance zone, it could start another decline. Immediate support on the downside is near the $67,000 level.
The first major support is $65,000. The main support sits at $64,500. If there is a close below $64,500, the price could start a drop toward the $63,500 level. Any more losses might send the price toward the $62,000 support zone.
Technical indicators:
Hourly MACD – The MACD is now losing pace in the bearish zone.
Hourly RSI (Relative Strength Index) – The RSI for BTC/USD is now above the 50 level.
Major Support Levels – $66,500, followed by $65,000.
Major Resistance Levels – $69,200, $70,000, and $71,200.
[#item_full_content]NewsBTCRead MorePresident Trump’s proposed tariffs and U.S. tensions with Iran have weighed on broader risk sentiment.Read…
Bitcoin fell to $64,270 shortly after midnight UTC before rebounding to $66,300, as thin liquidity…
Bitcoin Magazine Bitdeer (BTDR) Dumps Bitcoin Treasury After Eight-Week Drawdown, Holds Zero BTC Bitdeer Technologies…
Singapore based BTC and AI miner sells all holdings to build liquidity for expansion, signaling…
Users' bitcoin holdings in wallets linked to Binance have climbed to highest since late 2024.Read…
Bitcoin futures positioning among non-commercial traders is swinging sharply toward net long exposure, a move…