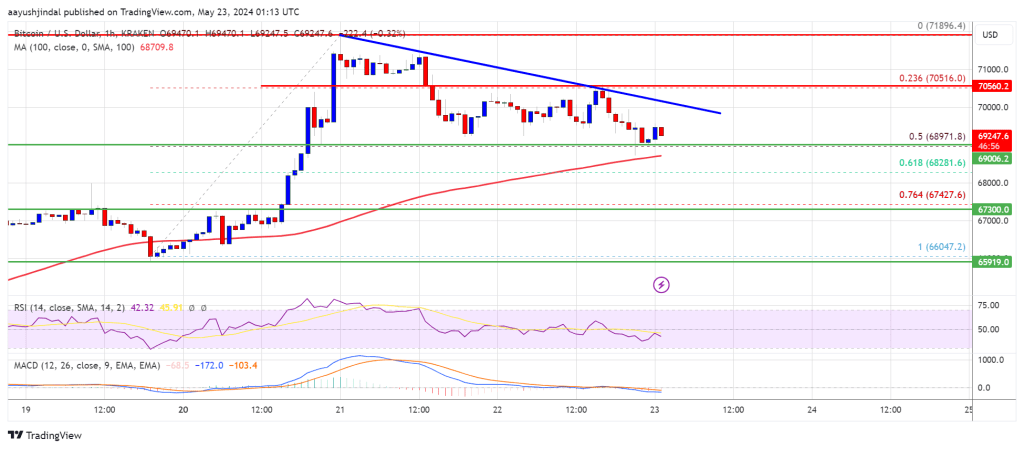
Bitcoin price started a downside correction below the $70,000 level. BTC is now testing the $68,800 support and might attempt a fresh increase.
Bitcoin extended its decline below the $70,000 support zone.
The price is trading above $68,000 and the 100 hourly Simple moving average.
There is a connecting bearish trend line forming with resistance at $70,000 on the hourly chart of the BTC/USD pair (data feed from Kraken).
The pair could start another increase unless there is a close below $68,800.
Bitcoin price started a downside correction after it struggled above the $71,500 level. A new weekly high was formed at $71,896 and the price recently started a downside correction.
The price declined below the $70,000 level and tested the 50% Fib retracement level of the upward wave from the $66,046 swing low to the $71,896 high. There was also a spike below the $68,800 support zone. The bulls are currently active near the $68,800 zone.
Bitcoin price is now trading above $68,000 and the 100 hourly Simple moving average. The price is now facing resistance near the $69,650 level. The first major resistance could be $70,000. There is also a connecting bearish trend line forming with resistance at $70,000 on the hourly chart of the BTC/USD pair.
The next key resistance could be $70,500. A clear move above the $70,500 resistance might send the price higher. In the stated case, the price could rise and test the $71,200 resistance.
If the bulls push the price further higher, there could be a move toward the $71,800 resistance zone. Any more gains might send BTC toward the $72,500 resistance.
If Bitcoin fails to climb above the $70,000 resistance zone, it could continue to move down. Immediate support on the downside is near the $69,000 level.
The first major support is $68,800. The next support is now forming near $67,420 or the 76.4% Fib retracement level of the upward wave from the $66,046 swing low to the $71,896 high. Any more losses might send the price toward the $66,000 support zone in the near term.
Technical indicators:
Hourly MACD – The MACD is now losing pace in the bearish zone.
Hourly RSI (Relative Strength Index) – The RSI for BTC/USD is now below the 50 level.
Major Support Levels – $69,000, followed by $68,800.
Major Resistance Levels – $70,000, $70,500, and $71,200.
[#item_full_content]NewsBTCRead MoreThe IMF confirmed that all bitcoin added to official holdings since June 2025 was sourced…
Every fund in the complex rose almost 6% on Thursday and net assets crossed $103…
Bitcoin is pulling ahead of gold even as both hard assets rally together, driven by…
Every major token gained on Friday as traders cut bets on a September Federal Reserve…
Bitcoin Magazine Bitcoin Bear Market May Not Yet Be Over, Says Fidelity Bitcoin may be…
The SEC has approved a Cboe Options Exchange rule amendment allowing listed options on the…