Bitcoin price struggled to clear the $59,500 level. BTC is moving lower and now at risk of more downsides toward the $56,000 level.
Bitcoin started another decline from the $59,475 resistance zone.
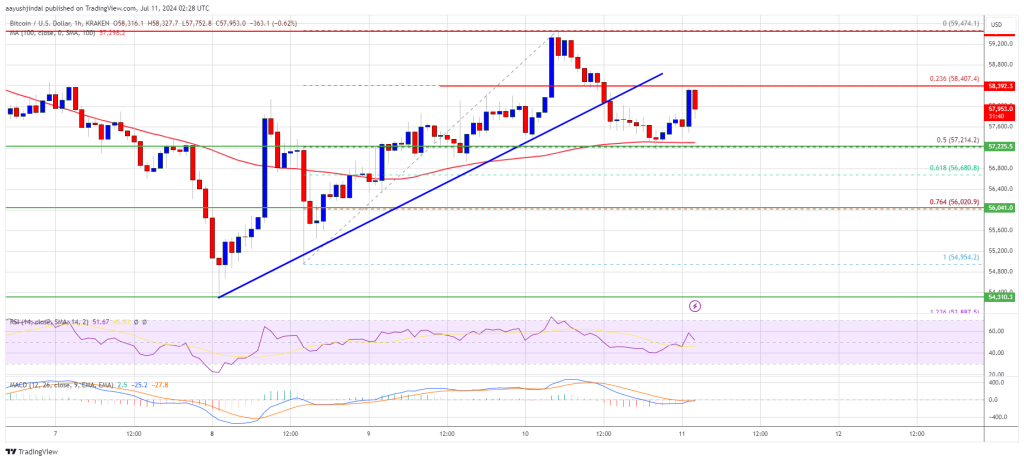
The price is trading above $57,200 and the 100 hourly Simple moving average.
There was a break below a key bullish trend line with support at $57,900 on the hourly chart of the BTC/USD pair (data feed from Kraken).
The pair might start another major decline if it fails to stay above the $57,200 support.
Bitcoin price extended its recovery wave above the $57,500 level. BTC even climbed above the $58,500 level. However, the bears are active near the $59,500 resistance zone.
A high was formed at $59,474 and the price is now correcting gains. There was a move below the $58,500 level. The price tested the 50% Fib retracement level of the upward move from the $54,955 swing low to the $59,474 high. Besides, there was a break below a key bullish trend line with support at $57,900 on the hourly chart of the BTC/USD pair.
The bulls seem to be active above the $57,200 level. Bitcoin price is now trading above $57,200 and the 100 hourly Simple moving average. Immediate resistance on the upside is near the $58,400 level.
The first key resistance is near the $58,800 level. A clear move above the $58,800 resistance might start a decent increase in the coming sessions. The next key resistance could be $59,500. The next major hurdle sits at $60,000. A close above the $60,000 resistance might start a steady increase and send the price higher. In the stated case, the price could rise and test the $62,500 resistance.
If Bitcoin fails to climb above the $58,400 resistance zone, it could start another decline. Immediate support on the downside is near the $57,200 level.
The first major support is $56,000 and the 76.4% Fib retracement level of the upward move from the $54,955 swing low to the $59,474 high. The next support is now near $55,000. Any more losses might send the price toward the $53,500 support zone in the near term.
Technical indicators:
Hourly MACD – The MACD is now losing pace in the bullish zone.
Hourly RSI (Relative Strength Index) – The RSI for BTC/USD is now above the 50 level.
Major Support Levels – $57,200, followed by $56,000.
Major Resistance Levels – $58,400, and $59,500.
[#item_full_content]NewsBTCRead MoreOnchain data shows multiple cost basis metrics confirm heavy demand and investor conviction around the…
Bitcoin’s bearish momentum has since reached a cool-off state, as price maintains above the last…
Executive John Ameriks emphasized Vanguard's core view of the crypto sector hasn't changed, seeing the…
The recommendation is in line with other global asset managers like BlackRock and Bank of…
The Bitcoin market is experiencing a gradual trend reversal following weeks of prolonged price correction…
Rising Japanese rates and a stronger yen threaten carry trades and could pressure crypto markets…