Bitcoin price started an upside correction from the $26,550 zone. BTC is rising and facing a strong resistance near the $27,300 and $27,500 levels.
Bitcoin managed to recover above the $27,000 resistance zone.
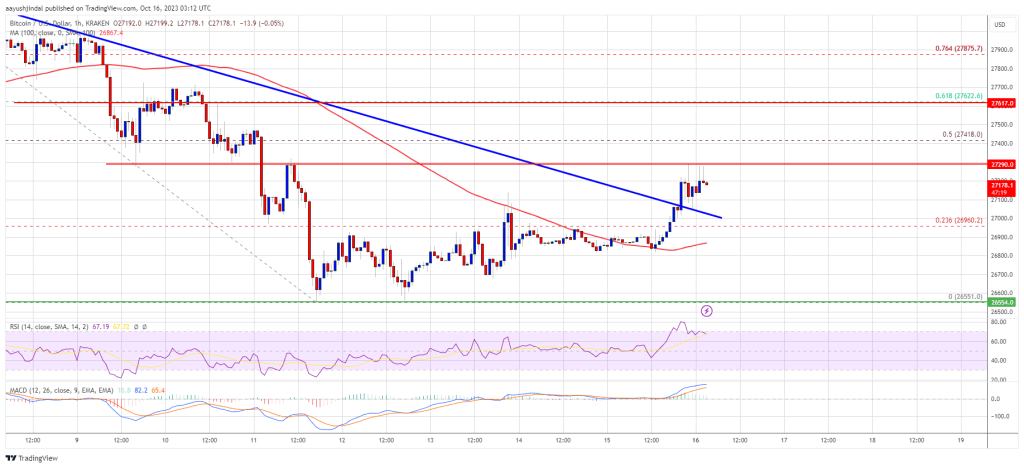
The price is trading above $27,000 and the 100 hourly Simple moving average.
There was a break above a major bearish trend line with resistance near $27,000 on the hourly chart of the BTC/USD pair (data feed from Kraken).
The pair is showing signs of a recovery, but it could struggle near $27,300 and $27,500.
Bitcoin price found support near the $26,550 level. BTC bears attempted to clear $26,550, but they failed. As a result, the price started an upside correction above the $26,800 resistance.
There was a move above the 23.6% Fib retracement level of the downward move from the $28,285 swing high to the $26,550 low. Besides, there was a break above a major bearish trend line with resistance near $27,000 on the hourly chart of the BTC/USD pair.
Bitcoin is now trading above $27,000 and the 100 hourly Simple moving average. It seems like the price is facing a strong resistance near the $27,300 level.
The next key resistance could be near $27,500 or the 61.8% Fib retracement level of the downward move from the $28,285 swing high to the $26,550 low. A clear move above the $27,500 and $27,650 resistance levels could set the pace for a larger increase.
Source: BTCUSD on TradingView.com
The next key resistance could be $28,000. A close above the $28,000 resistance might start a steady increase toward the $28,500 level. Any more gains might send BTC toward the $29,200 level.
If Bitcoin fails to recover higher above the $27,500 resistance, there could be a fresh decline. Immediate support on the downside is near the $27,000 level and the trend line zone.
The next major support is near the $26,900 level and the 100 hourly Simple moving average. A downside break and close below the $26,900 support might send the price further lower. The next support sits at $26,550.
Technical indicators:
Hourly MACD – The MACD is now losing pace in the bullish zone.
Hourly RSI (Relative Strength Index) – The RSI for BTC/USD is now above the 50 level.
Major Support Levels – $27,000, followed by $26,900.
Major Resistance Levels – $27,300, $27,500, and $27,650.
[#item_full_content]NewsBTCRead MoreA 33-day dry spell for solo Bitcoin miners ended last week when one small operator…
Crypto analyst Kabuki has explained why the Bitcoin rainbow chart shows that the price range…
Bitcoin Magazine Even a 1% Bitcoin Allocation Can Drastically Reshape Portfolio Risk, Schwab Finds A…
The asset manager's research arm argues the technical path to quantum-safe blockchains is clear but…
Bitcoin Magazine Morgan Stanley’s Bitcoin ETF MBST To Go Live Tomorrow, 16,000 Advisors Ready To…
Bitcoin Magazine Bitcoin Price Slides Below $68,000 as Trump, Iran Tensions Rattle Markets Bitcoin price…