Bitcoin price is slowly moving lower from the $17,000 resistance. BTC could continue to move down towards the $16,000 support zone.
Bitcoin started a fresh decline after it failed to clear the $17,000 and $17,200 resistance levels.
The price is trading below $16,700 and the 100 hourly simple moving average.
There is a key bearish trend lie forming with resistance near $16,600 on the hourly chart of the BTC/USD pair (data feed from Kraken).
The pair could drop further if there is a clear move below the $16,500 support zone.
Bitcoin price failed to gain pace above the $17,000 resistance zone. BTC started a fresh decline below the $16,800 support zone to move into a bearish zone.
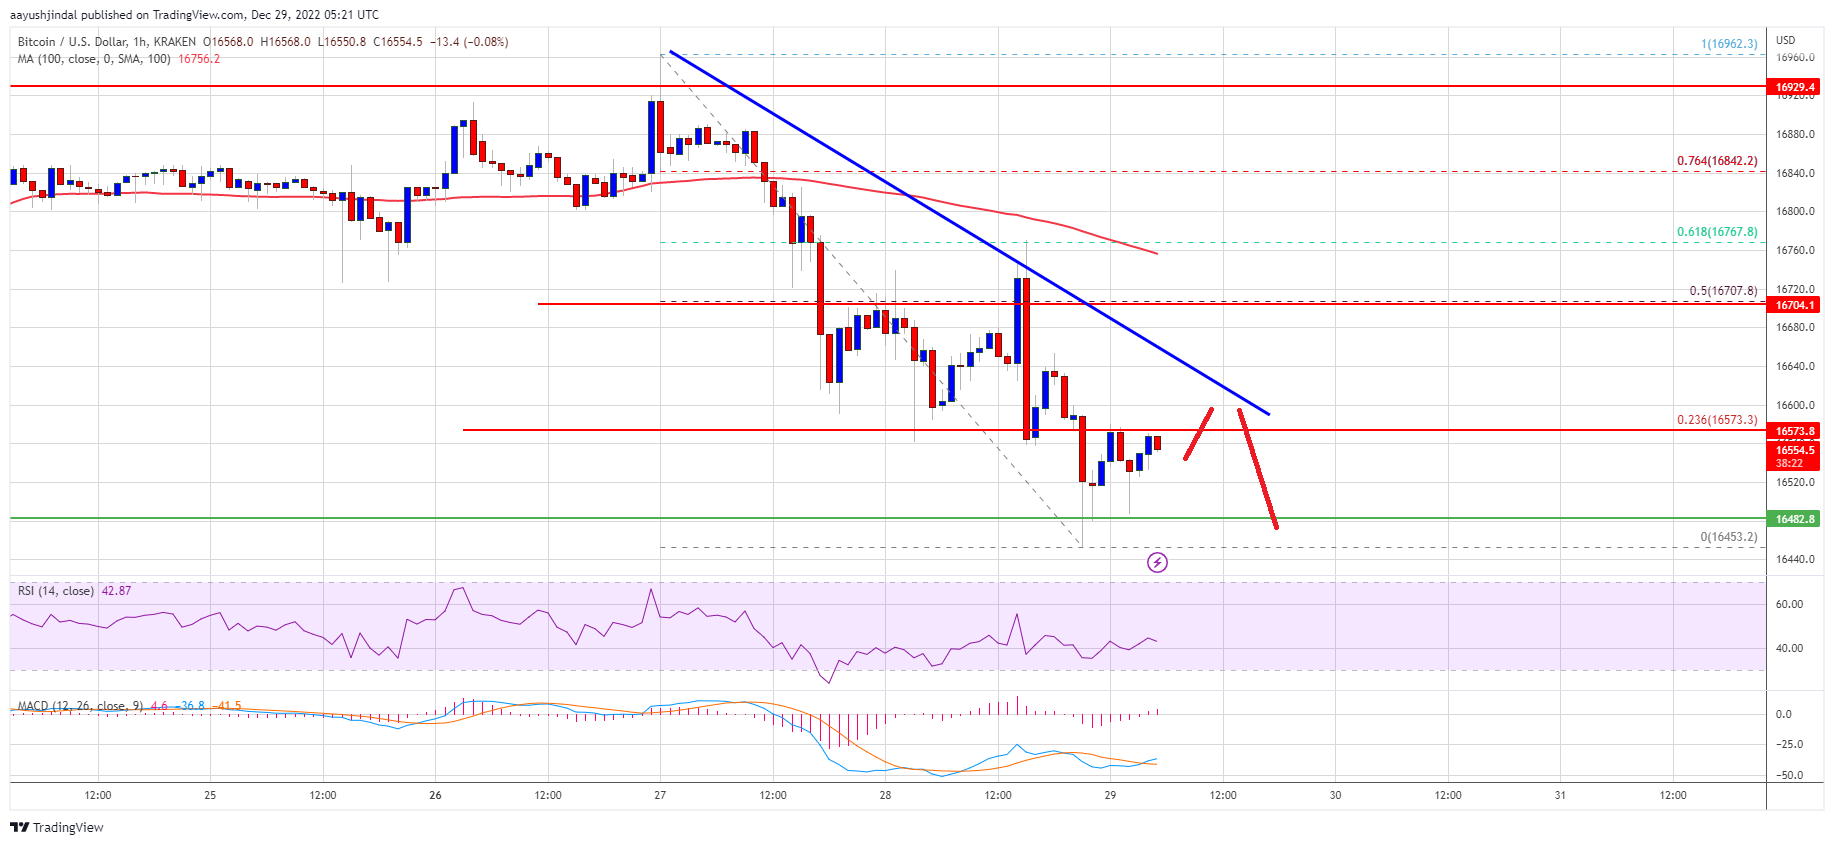
The price even traded below the $16,650 support zone and the 100 hourly simple moving average. It traded as low as $16,453 and is currently consolidating losses. The price is clearly trading in a bearish zone below $16,700 and the 100 hourly simple moving average.
Bitcoin price is now facing resistance near the $16,580 level. It is close to the 23.6% Fib retracement level of the downward move from the $16,961 swing high to $16,453 low. There is also a key bearish trend lie forming with resistance near $16,600 on the hourly chart of the BTC/USD pair.
The first major resistance is near the $16,700 zone and the 100 hourly SMA. It is close to the 50% key bearish trend lie forming with resistance near $16,600 on the hourly chart of the BTC/USD pair.
Source: BTCUSD on TradingView.com
The main hurdle is still near the $17,000 level. A proper close above the $17,000 resistance might start a steady increase in the near term. The next major resistance is near $17,200, above which the price rise towards the $17,500 resistance zone.
If bitcoin fails to start a recovery wave above the $16,700 resistance, it could continue to move down. An immediate support on the downside is near the $16,450 level.
The next major support is near the $16,200 level. A downside break below the $16,200 support might spark a move towards the $16,000 level. Any more losses might send the price towards $15,550.
Technical indicators:
Hourly MACD – The MACD is now gaining pace in the bearish zone.
Hourly RSI (Relative Strength Index) – The RSI for BTC/USD is now below the 50 level.
Major Support Levels – $16,450, followed by $16,200.
Major Resistance Levels – $16,700, $17,000 and $17,200.
Bitcoin price is slowly moving lower from the $17,000 resistance. BTC could continue to move down towards the $16,000 support zone.
Bitcoin started a fresh decline after it failed to clear the $17,000 and $17,200 resistance levels.
The price is trading below $16,700 and the 100 hourly simple moving average.
There is a key bearish trend lie forming with resistance near $16,600 on the hourly chart of the BTC/USD pair (data feed from Kraken).
The pair could drop further if there is a clear move below the $16,500 support zone.
Bitcoin price failed to gain pace above the $17,000 resistance zone. BTC started a fresh decline below the $16,800 support zone to move into a bearish zone.
The price even traded below the $16,650 support zone and the 100 hourly simple moving average. It traded as low as $16,453 and is currently consolidating losses. The price is clearly trading in a bearish zone below $16,700 and the 100 hourly simple moving average.
Bitcoin price is now facing resistance near the $16,580 level. It is close to the 23.6% Fib retracement level of the downward move from the $16,961 swing high to $16,453 low. There is also a key bearish trend lie forming with resistance near $16,600 on the hourly chart of the BTC/USD pair.
The first major resistance is near the $16,700 zone and the 100 hourly SMA. It is close to the 50% key bearish trend lie forming with resistance near $16,600 on the hourly chart of the BTC/USD pair.
Source: BTCUSD on TradingView.com
The main hurdle is still near the $17,000 level. A proper close above the $17,000 resistance might start a steady increase in the near term. The next major resistance is near $17,200, above which the price rise towards the $17,500 resistance zone.
If bitcoin fails to start a recovery wave above the $16,700 resistance, it could continue to move down. An immediate support on the downside is near the $16,450 level.
The next major support is near the $16,200 level. A downside break below the $16,200 support might spark a move towards the $16,000 level. Any more losses might send the price towards $15,550.
Technical indicators:
Hourly MACD – The MACD is now gaining pace in the bearish zone.
Hourly RSI (Relative Strength Index) – The RSI for BTC/USD is now below the 50 level.
Major Support Levels – $16,450, followed by $16,200.
Major Resistance Levels – $16,700, $17,000 and $17,200.
Tags: bitcoinbitcoin pricebtcusdBTCUSDTxbtusd
NewsBTCRead More
Bitcoin and other risk assets have been whipsawed by President Donald J. Trump’s shifting rhetoric…
Bitcoin is struggling to reclaim $70,000. The price chart looks uninspiring. And according to the…
Crypto and equities sold off after the president's national address undermined a two-day rally built…
Brent crude futures on Hyperliquid recorded $46.6 million in liquidations, behind only ether and bitcoin.…
A cluster of roughly 650,000 Bitcoin sits at the $70,000–$72,000 price range — coins bought…
Bitcoin price started a recovery wave above $68,000. BTC is now struggling to surpass $68,800…