Bitcoin price struggled to settle above the $65,000 zone. BTC is again moving lower and there is a risk of more downsides below $62,000.
Bitcoin started another decline after it failed to surpass the $64,000 resistance zone.
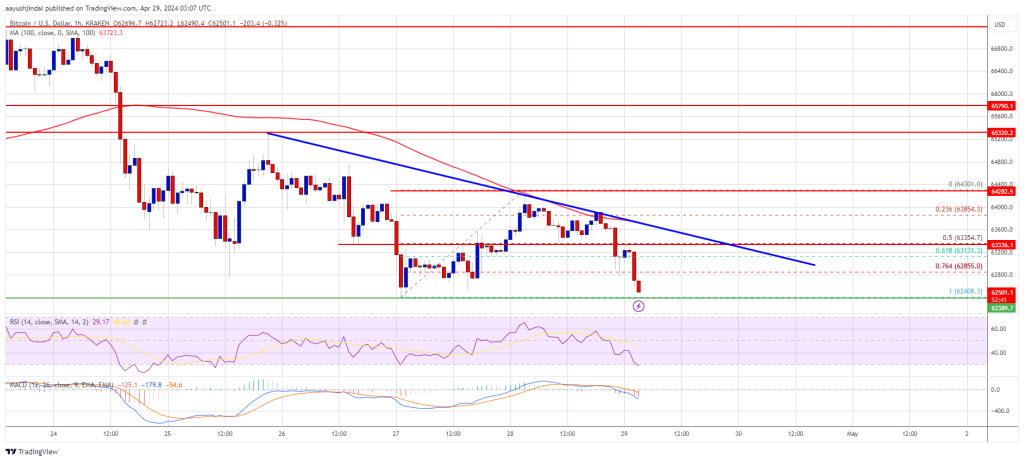
The price is trading below $64,500 and the 100 hourly Simple moving average.
There is a key bearish trend line forming with resistance at $63,350 on the hourly chart of the BTC/USD pair (data feed from Kraken).
The pair could accelerate lower if there is a daily close below the $62,400 support zone.
Bitcoin price attempted a fresh increase above the $64,000 zone. However, BTC failed to gain pace for a move above the $65,000 resistance zone. A high was formed at $64,301 and the price started another decline.
There was a move below the $63,800 level. The price declined below the 50% Fib retracement level of the upward move from the $62,408 swing low to the $64,301 high. Bitcoin is now trading below $63,200 and the 100 hourly Simple moving average.
There is also a key bearish trend line forming with resistance at $63,350 on the hourly chart of the BTC/USD pair. The pair is signalling a bearish bias below the 76.4% Fib retracement level of the upward move from the $62,408 swing low to the $64,301 high.
Immediate resistance is near the $63,350 level or the trend line. The first major resistance could be $64,000 or $64,300. A clear move above the $64,300 resistance might send the price higher. The next resistance now sits at $65,000.
Source: BTCUSD on TradingView.com
If there is a clear move above the $65,000 resistance zone, the price could continue to move up. In the stated case, the price could rise toward $65,500. The next major resistance is near the $66,200 zone. Any more gains might send Bitcoin toward the $67,500 resistance zone in the near term.
If Bitcoin fails to rise above the $63,350 resistance zone, it could continue to move down. Immediate support on the downside is near the $62,400 level.
The first major support is $62,000. If there is a close below $62,000, the price could start to drop toward $61,200. Any more losses might send the price toward the $60,000 support zone in the near term.
Technical indicators:
Hourly MACD – The MACD is now gaining pace in the bearish zone.
Hourly RSI (Relative Strength Index) – The RSI for BTC/USD is now below the 50 level.
Major Support Levels – $62,400, followed by $62,000.
Major Resistance Levels – $63,350, $64,000, and $65,000.
[#item_full_content]NewsBTCRead MoreBitcoin (BTC) is currently navigating a trading range between $60,000 and $73,000, entering what analytics…
Tokyo-listed Metaplanet is expanding beyond holding BTC into funding, incubating, and granting to companies building…
The bridging protocol's team wants to exchange ACX tokens for equity in a new U.S.…
Brent crude surged 10% after attacks on two oil tankers in Iraqi waters, with the…
Bitcoin price failed to extend its recovery wave above the $70,500 zone. BTC is now…
Bitcoin Magazine Coinbase CPO Rejects Claims of Opposing Bitcoin Tax Relief as Jack Dorsey Demands…